Image Processing Reference
In-Depth Information
520
y
530
0.8
540
510
550
0.7
560
0.6
570
500
580
0.5
590
600
0.4
610
630
680
0.3
490
0.2
480
0.1
470
470
460
460
420
0.0
420
x
0.0
0.1
0.2
0.3
0.4
0.5
0.6
0.7
0.8
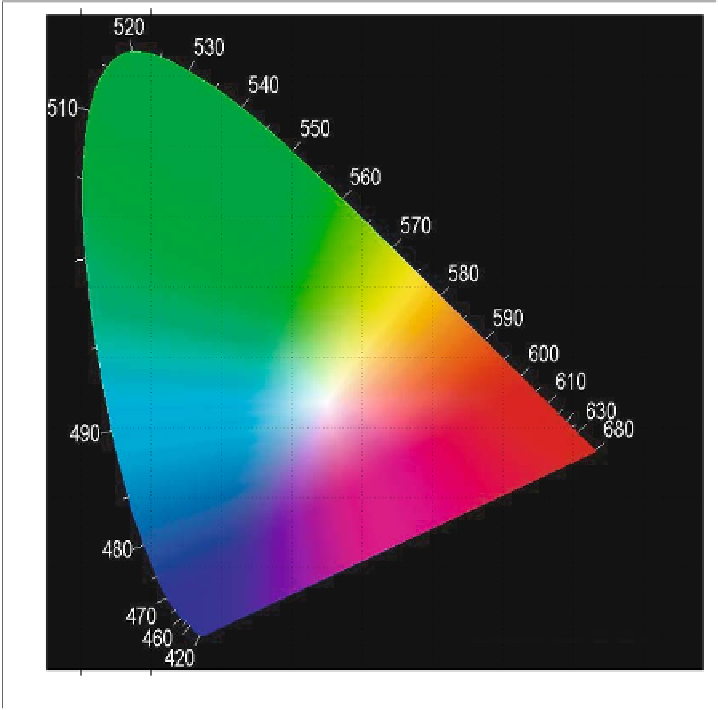
Fig. 2.2. The perceivable colors and their wavelengths, according to CIE (1931) standard on
color
X
X
+
Y
+
Z
x
=
(2.3)
Y
X
+
Y
+
Z
y
=
(2.4)
Z
X
+
Y
+
Z
z
=
(2.5)
where
x
+
y
+
z
=1, its so that only two of
x
,
y
,
z
are independent, making the
projection a planar surface. In Fig. 2.2
x
and
y
are the coordinate axes. After having
projected its
X, Y, Z
values via Eqs. (2.3)-(2.5), each perceived color is a point on
the CIE diagram. The projection amounts to a normalization of the 3D XYZ space
with respect to luminosity,
X
+
Y
+
Z
. The 2D
xy color space
represents the colors
appearing in the CIE diagram.