Image Processing Reference
In-Depth Information
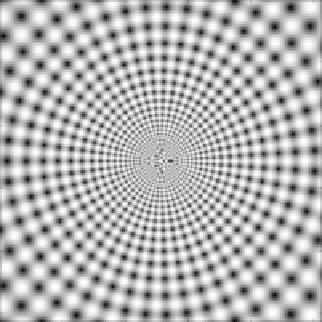
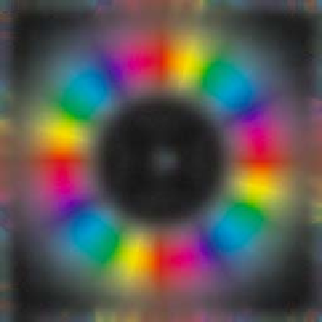
Fig. 14.6. The test image FMTEST2 and
I
40
computed for all local images. The intensity and
the hue are modulated by the magnitude and the argument of
I
40
The structure tensor in theorems 10.2, and 10.4 can be obtained as special cases
of this theorem with
n
=2. Furthermore, we ended up with the same basic computa-
tional scheme consisting of three consecutive operations—two linear-filtering steps,
linked by an intermediary, nonlinear-mapping step:
First Linear-Filtering: Apply a symmetry derivative filtering,
Nonlinear-Mapping: Apply a pointwise squaring,
Second Linear-Filtering: Apply a symmetry derivative filtering.
The symmetry derivative filter in the first step, (
D
x
+
iD
y
)
n
2
, is more elaborate
as compared to
D
x
+
iD
y
, which is used in linear symmetry detection. The last step
uses the zero-order symmetry derivative filter in both cases, average-filtering.
Surprisingly, even the GST scheme, developed to detect nontexture patterns, e.g.,
parabolic patterns, log-spirals, crosses, etc., see lemma 11.6, shares the same compu-
tational steps as above. Additionally, the filters used in the first step here are similar
to those derived for the last step of the GST scheme. By contrast, in the first step of
the GST, the simple, first-order symmetry derivative filter,
D
x
+
iD
y
, is mandatory
whereas more elaborate filters are reserved for the last step. As will be discussed
below, and in Section 14.6, to allow high-order symmetries at the first step ensures
that multiple directions can be seen as equivalent by the detection process. This will
in turn provide translation-invariant
texture
features.
It is worth noting that linearly symmetric patterns can conceptually belong to
both object-, and texture-type patterns. In isolation, they can on one hand be viewed
as being harmonic monomial objects with the trivial harmonic mapping (the identity
transformation in GST) whereas on the other hand, they are the simplest textures
containing line patterns, those having a
single direction
when repeated.
To visualise the effect of computing complex moments in the local power spec-
trum, we show
I
40
applied to FMTEST2 in Fig. 14.6. The hue and intensity represent