Image Processing Reference
In-Depth Information
F
7%
9%
9%
5%
2%
M
5%
7%
11%
6%
4%
A1
A2
A3
A4
A5
F
9%
40%
3%
15%
1%
M
8%
31%
2%
24%
1%
A6
A7
A8
A9
A10
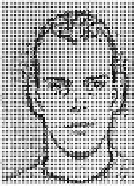
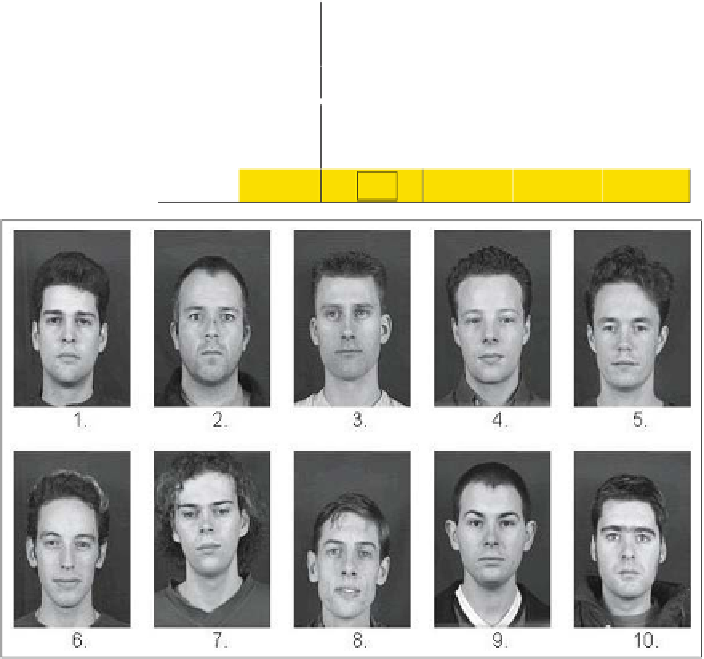
Fig. 1.10. A question used in human face recognition test and the response distribution of the
subjects. The
rows F and M
represent the female and the male responses, respectively. The
rectangle indicates the alternative that actually matches the stimulus