Image Processing Reference
In-Depth Information
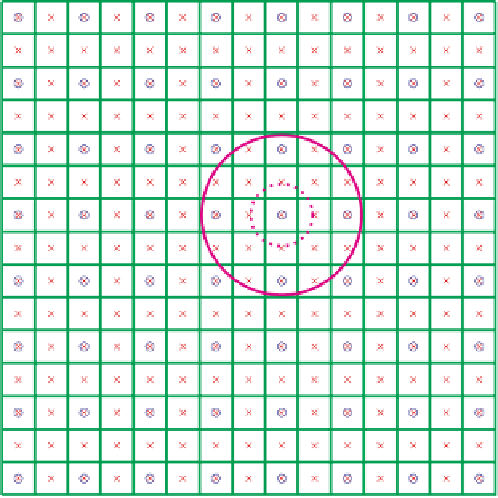
Fig. 9.7. The graph represents the down-sampling of an image with the factor 2. The crosses
with rings show the placement of the interpolation function where the scalar products between
the filter and the image data are computed. Two isocurves of such an interpolation function
are shown by two concentric circles (magenta)
the loci where the (continuous) interpolation function with
σ
=0
.
8 reaches 0.5
(dashed) and 0.01 (solid) levels, respectively.
9.5 Gaussian and Laplacian Pyramids
Useful shape properties describing size and granularity can be extracted for numer-
ous applications by
scale space
[128, 141, 152, 221, 230] techniques, of which image
pyramids [43, 160] are among the most efficient to compute. The
Gaussian pyramid
of an image is a hierarchy of lowpass filtered versions of the original image, such that
successive levels correspond to lower frequencies. Because of the effectuated low-
pass filtering one can reduce the image size without loss of information. The lowpass
filtering is done using convolution with either a Gaussian filter or similar. Where the
filter overhangs the image boundaries one can reflect the image about its boundary.
There are, however, other possibilities to avoid the artificial irregularities the bound-
aries cause, e.g., extension with zeros. The cut-off frequency of the Gaussian filters
can be controlled using the parameter
σ
, offering different size reduction rates,
κ
,
which refers to the reduction rate an image boundary, e.g., the image width in 2D. If
the reduction rate is
κ
=2then the pyramid is called an octave pyramid. One may

