Biomedical Engineering Reference
In-Depth Information
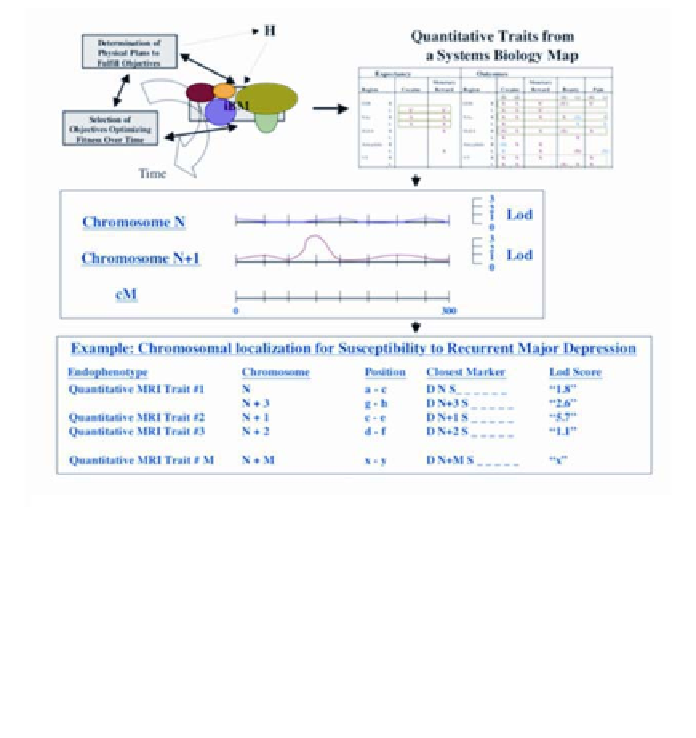
Figure 16
. This schematic illustrates a possible "top-down" approach for identifying genes associ-
ated with a susceptibility or resistance to major depressive disorder. Overlapping sampling of cir-
cuitry processing reward/aversion input (cartoon in top left) from families with depression, could be
used to produce a systems biology map (cartoon top right). Disease susceptibility would be defined
by continuous quantitative traits measured from systems biology (as with MRI), and could be used
to perform a total genome scan and a multipoint linkage analysis using a variance component ap-
proach (for quantitative and potential qualitative traits). Gene identification could then be achieved
via analysis of microsatellite repeats and SNP markers. Figure adapted with permission from Breiter
and Gasic (36).
of having a particular set of epigenetic elements (e.g., this might be expressed as
P
(illness)
P
(allele, locus) +
P
(Endophenotype N,
t
) +
P
(Epigenome,
t
)).
Epigenetic elements appear to be species-specific (260), and may explain sig-
nificant differences in phenotypes between species that otherwise have 99%
sequence similarity (271). Until specific genetic variations are identified, phy-
logenetically lower animal species may only serve as course models for the
complex neuropsychiatric diseases.
Epigenetic contributions may partly explain the difficulties underlying ge-
netic linkage and association studies for these illnesses. Coarse clinical pheno-
types and dichotomous behavioral distinctions rather than quantitative markers
(endophenotypes) to cluster subjects is another confounding aspect for these
studies. Activity in a variable number of distinct, distributed neural groups may
yield multiple endophenotypes for an illness, yet produce indistinguishable
symptom/sign clusters. The spatiotemporal scale of distributed cell groups is