Biomedical Engineering Reference
In-Depth Information
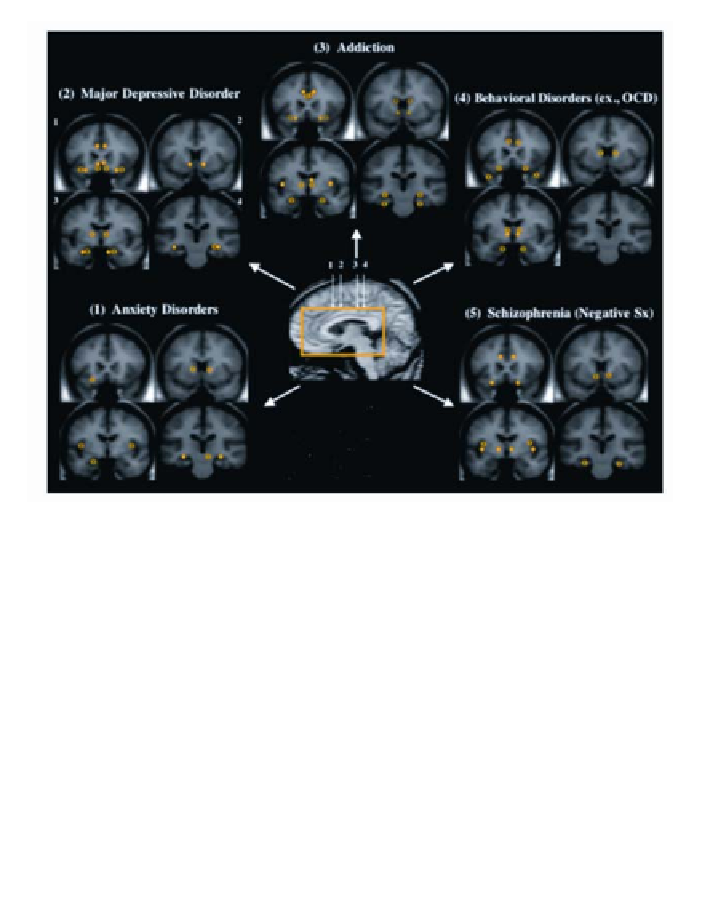
Figure 12
. The same structural scans shown in Figure 11 are displayed here, grouped two-by-two,
and numbered to correspond with the anterior-to-posterior orientation. Groupings (1)-(5) are placed
around a central sagittal slice indicating the general location of each coronal slice relative to a yel-
low rectangle around brain regions hypothesized to mediate reward/aversion functions. These
groupings represent partial consolidations of reports in the neuroimaging literature comparing pa-
tient groups to healthy controls. Neuroimaging measures include (a) structural differences, (b) blood
flow, receptor binding, or resting metabolism, (c) blood flow or metabolic responses to normative
stimuli (i.e., pictures of masked emotional faces presented to subjects with post-traumatic stress
disorder), or (d) magnetic resonance spectroscopy measures. As in Figure 11, regions with func-
tional differences (b,c above) between subjects and healthy controls are noted with an "O" symbol.
Regions with differences in regional morphology, volume, or spectroscopy signal from healthy
baselines (a,d above) are noted with a diamond. Regions with an asterisk indicate that a set of stud-
ies found differences between patients and healthy controls for a large region, but a more recent
study with improved spatial resolution noted an effect for the same experimental paradigm (i.e.,
drug infusions) localized to a specific subregion (i.e., the NAc vs. the basal ganglia). This consolida-
tion of psychiatric neuroimaging findings suggests that neuropsychiatric illness may in the future be
objectively diagnosed by use of circuitry-based measures. Figure adapted with permission from
Breiter and Gasic (32).
analysis of the neuropsychiatric imaging literature, with a focus on brain sys-
tems that collectively process reward/aversion information (Figure 12), suggests
that such an approach could segregate major categories such as the anxiety dis-
orders, major depressive disorder, addiction, the behavioral disorders, and
schizophrenia. The metaanalysis in Figure 12 compiled studies comparing pa-
tients to unaffected controls for each of the major categories of neuropsychiatric
illnesses on the basis of (a) patterns of resting brain metabolism, blood flow, or