Biomedical Engineering Reference
In-Depth Information
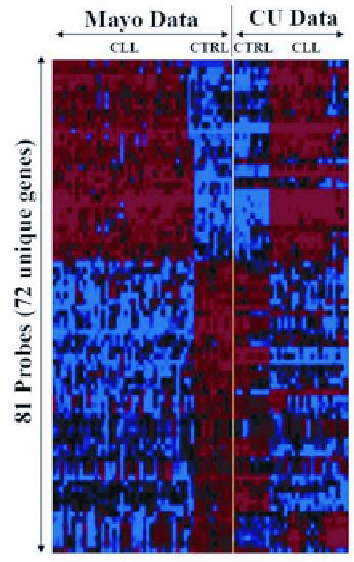
Figure 3
. Identification of genes differentially expressed in CLL and normal B cells. Each row
corresponds to a different gene, whereas each column is a different patient. The data to the left
of the yellow line represent the supervised cluster analysis of 38 control CLL samples and 10
CLL samples using a combination of gene selection methods in data collected at the Mayo
Clinic (Mayo data) (45,46). Rows correspond to genes and color changes within a row indicate
expression levels relative to the average of the sample population (blue and red are low- and
high-expression levels, respectively). The data to the right of the yellow line represent 10 con-
trols and 21 CLL patients studied in a Columbia University (CU data) (45,52,53). The genes
identified in the Mayo data that discriminate between normal B and CLL cells also discrimi-
nate normal B from CLL cells in the CU data.
mon by the two methods. This indicates that each of these methods interrogates
the data in specific and different ways, as was discussed at length in a different
example from the previous section.
The results of the analyses referred to above are shown in the colored ma-
trix to the left of the yellow line in Figure 3, where we show an Eisen plot with
the 81 probes (72 unique genes) and their differential expression in the
CLL/control data collected in the Mayo Clinic (45) (the Mayo data). In Figure 3
the genes and the patients are ordered according to a hierarchical clustering or-
ganization. The differential behavior of these genes in the CLL cases and normal