Biomedical Engineering Reference
In-Depth Information
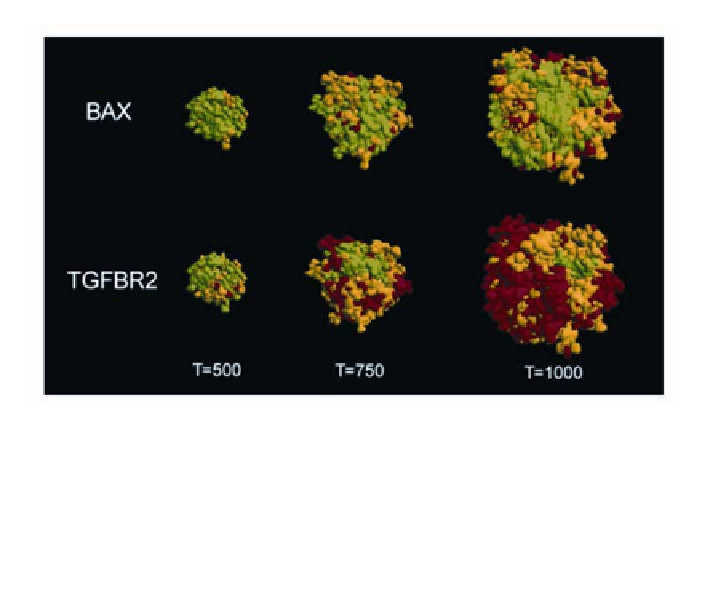
Figure 4
. An example of the 3D simulation model using optimal parameters. Here the spatial
distribution of the two genes under consideration is shown. Green, yellow, and red correspond
to wild type, one, and two mutations, respectively. BAX displays lower levels of mutation,
whereas TGFBR-2 presents larger red zones, indicating that homozygous mutations are wide-
spread.
and the constraints imposed by local interactions. Although the same model
achieves homogeneity under an absence of spatial constraints, it fails to do so
when a realistic spatial structure is introduced. The model thus provides an accu-
rate description of the basic rules operating through tumor progression and also
predicts a number of features (such as the relative mutation levels associated
with each mutation) that can be eventually tested from experiments.
6.
DISCUSSION
A study of the geography of genetic diversity present in human tumors with
a mutator phenotype revealed an unsuspected degree of diversity. Remarkably,
tumor cells could be found with a wild-type genotype in the midst of the tumoral
tissue. The ability to reproduce the results using a metapopulation dynamic
model suggests that the same fundamental principles that explain the lack of
dominance in complex ecosystems are at play in neoplasia and underlie the
maintenance of clonal diversity in human tumors. Study of the metapopulation
models further suggest that, in order to generate the degree of diversity ob-
served, the mutational rate can remain stable throughout the natural history of