Biomedical Engineering Reference
In-Depth Information
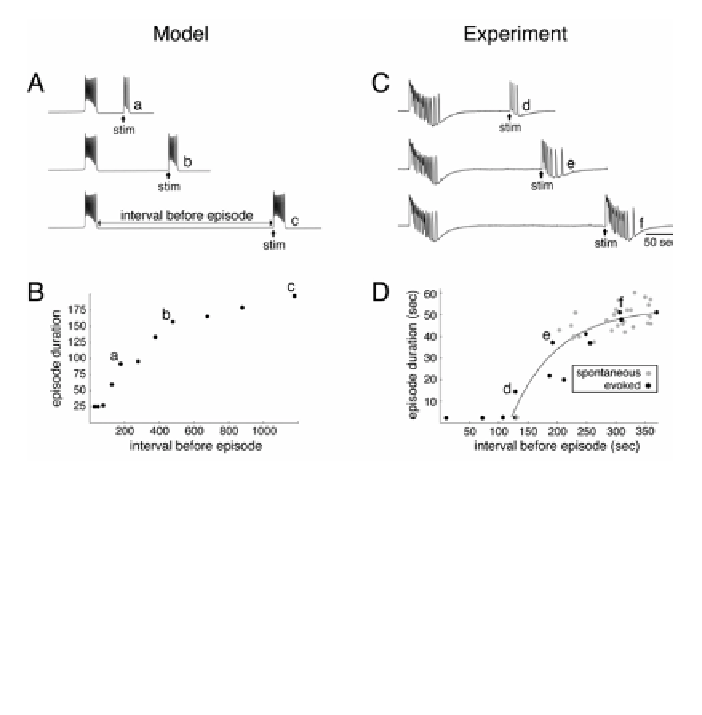
Figure 6
. Relationship between episode duration and interval preceding the episode. (
A
) Time
course of activity generated by the
s
-model for different intervals between a spontaneous epi-
sode and a triggered (stim) episode. (
B
) Plot of episode duration against preceding interval for
the model; a, b, c correspond to the traces shown in A. (
C
) Time course of activity generated
by a spinal cord obtained from a 10-day-old chick embryo. Stimulations (stim) were applied at
different time intervals after a spontaneous episode. Traces were high-pass filtered at 0.01 Hz.
(
D
) Plot of episode duration against preceding interval for evoked (black circles) and sponta-
neous episodes (gray circles); d, e, f correspond to the traces shown in C. Modified from Tabak
et al. (36).
a deterministic event. This seems to be a property of many developing or hyper-
excitable systems that generate episodic activity, since the same relationships
(positive correlation between episode duration and preceding—but not follow-
ing—interval) was found in the developing retina (14), developing cortical net-
works (27), hippocampal slices (33), and disinhibited spinal networks (32,35). It
is therefore tempting to suggest that similar mechanisms operate in the genera-
tion of episodic activity by all these different networks.
4.4. Recovery of the Activity after Blockade of Excitatory Connections
One of the most surprising features of the spontaneous activity is its robust-
ness to pharmacological perturbation. When synaptic transmission mediated by
the excitatory neurotransmitters glutamate and acetylcholine is blocked using
pharmacological agents, the spontaneous activity stops for a long period of time