Biomedical Engineering Reference
In-Depth Information
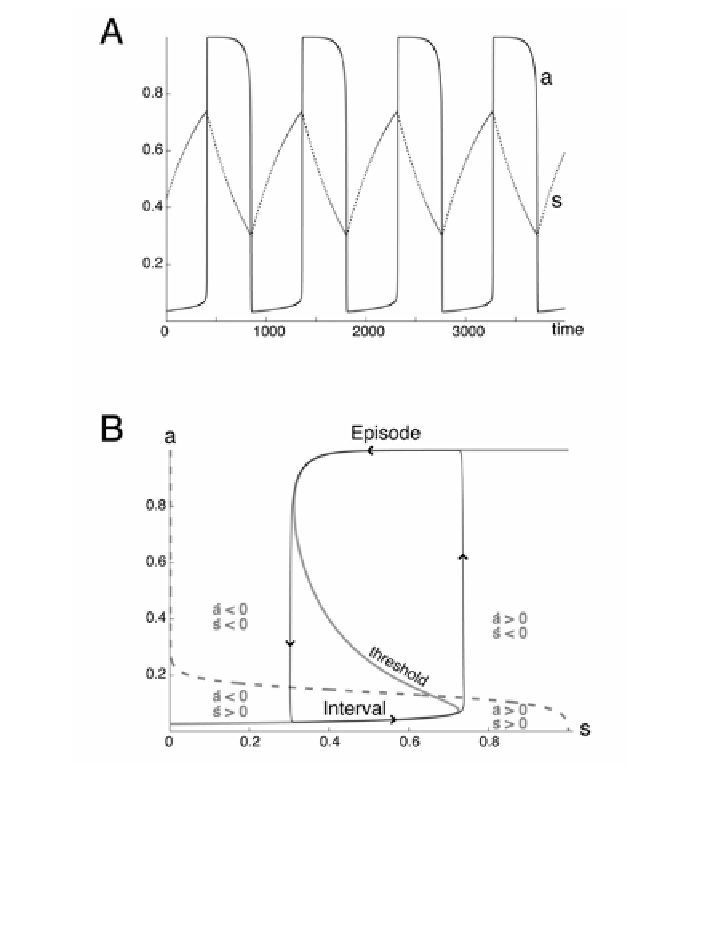
Figure 4
. Episodic behavior of the network (Eqs. [1] and [3]). (
A
) Slow oscillatory variations
of activity (
a
, solid curve) and slow depression variable (
s
, dotted curve) with time. Time is in
arbitrary units. (
B
) Phase plane representation of the episodic behavior. The trajectory continu-
ously cycles through the high (Episode) and low (Interval) activity states. The transitions be-
tween the two activity levels are very fast because they are governed by the small time constant
U
a
, while the evolution at either level is slow since it is governed by a large time constant U
s
.
Gray S-shaped curve =
a
-nullcline; dashed curve =
s
-nullcline.
slow, spontaneous oscillations between low and high states that mimic the epi-
sodic activity observed experimentally. Now, if we allow the fast depression
variable,
d
, to vary (according to Eq. [2]), the system may oscillate quickly dur-
ing each episode. The system then generates rhythmic episodes as shown in Fig-
ure 5. For a complete analysis of the full system using fast/slow dissection
technique, see Tabak et al. (36).