Biomedical Engineering Reference
In-Depth Information
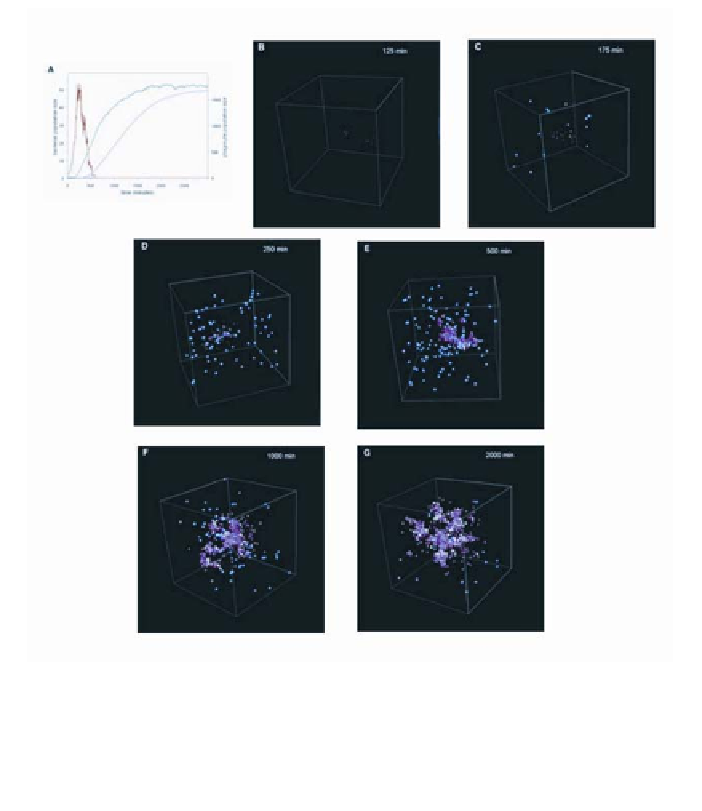
Figure 3
. In this simulation run the conditions are as in Figure 1, except that phagocytes pro-
duce PIC and the bacterial mean cell-cycle time is 72 minutes. The phagocytes still do not
produce sPICR. (
A
) The blue and yellow lines again depict phagocytes and bacteria, respec-
tively; the magenta line represents the total PIC concentration. (
B-G
) As in Figure 1.
result in greatly enhanced confidence in the results of these carefully calibrated
models, and that they will provide insight and play the role of valuable adjuncts
to empirical investigation for issues as critical and diverse as vaccine efficacy
and autoimmune disease.
5.
ACKNOWLEDGMENTS
I am grateful, as always, for invaluable discussions shared with the mem-
bers of the Duke University Laboratory of Computational Immunology—
particularly Lindsay Cowell and John Tomfohr—and for access to prepublica-