Biomedical Engineering Reference
In-Depth Information
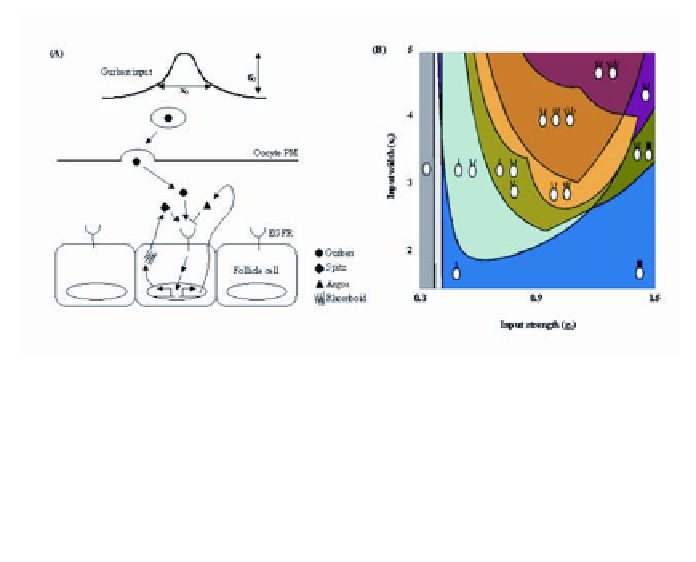
Figure 8
. (
A
) Input and feedback loops in the model of pattern formation by peak splitting. (
B
)
Summary of the results of computational analysis of the one-dimensional model of pattern
formation by
Drosophila
EGFR autocrine feedback loops. The regions of existence of different
stationary patterns as a function of the width (
x
0
) and the amplitude (
g
0
) of the input (Gurken)
signal. Patterns with different numbers of peaks are associated with the eggshells with different
numbers of dorsal appendages (shown by insets). See Shvartsman et al. (30) for a detailed
definition of model parameters and its computational analysis.
can generate eggshells with one or zero dorsal appendages. At the same time, an
increase in the dose leads to eggs with increased inter-appendage distance or one
broad dorsal appendage. These observations provide important constraints on
the modeling.
Analysis of the phenomenological model shows that the peak-splitting
mechanism can be realized in one spatial dimension (Figure 8B). This means
that a single-peaked input in the model, mimicking the oocyte-derived Gurken,
can generate a stable pattern with two large-amplitude peaks in the spatial distri-
bution of Rhomboid. The two-peaked pattern emerges as a result of the
instabil-
ity
of the one-peaked solution that is realized at lower inputs. At a critical input
level, this single-peaked solution splits, giving rise to the blueprint for formation
of two dorsal appendages. Thus, patterning leading to formation of dorsal ap-
pendages can be viewed as a transition between the two kinds of solutions in the
model (i.e., one- and two-peaked).
The variations in the level and the spatial distribution of Gurken input can
induce transitions between different classes of patterns that are characterized by
the different number of large-amplitude peaks in the spatial distribution of
Rhomboid. We correlate these patterns with the dorsal appendage phenotypes in
mutants with either lower Gurken doses or with defects in EGFR signal trans-
duction (Figure 8B) (20). Predicted transitions between the zero-, one-, and two-
peaked patterns in the model correspond to the experimentally observed transi-