Biomedical Engineering Reference
In-Depth Information
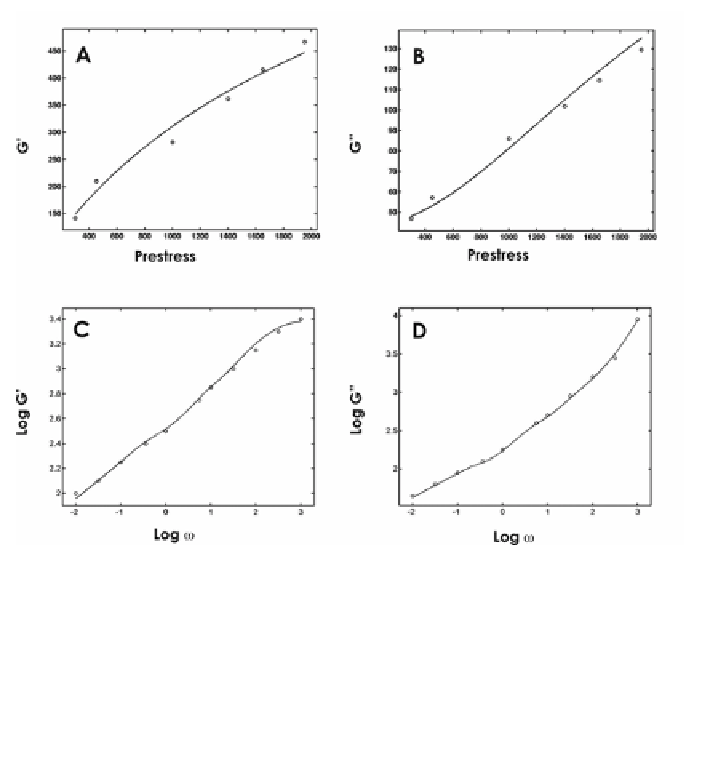
Figure 3
.
Emergent mechanical properties of the tensegrity model: simulation versus
experimental data
.
A
. Cellular elastic (
G
') and frictional (
G
'') moduli predicted by a computa-
tional tensegrity model (solid lines) versus data obtained from experiments with living cells
(circles) (64). Data in
A
and
B
that show the dependencies of moduli on prestress are re-plotted
from Stamenovic et al. (59); data in
C
and
D
that show frequency dependencies are re-plotted
from Fabry et al. (18). The frequency (X) is given in Hz, whereas prestress and elastic and
frictional moduli are in Pa.
computational tensegrity model revealed that these dependencies increased ap-
proximately linearly over a wide range of prestress (64). These results nicely
mimic experimental observations that demonstrated the same behavior in living
cells (59) (Figure 3) and confirm similar results obtained with a slightly different
tensegrity structure (5). Deviations from the experimental results were only ob-
served at very low prestress, where the cables are almost slack. Adherent living
cells actively generate tension within their contractile microfilaments and, thus,
their cytoskeleton is always prestressed. Importantly, analysis of the frequency
dependencies of
G
' and
G
'' of the tensegrity structure also revealed a wide distri-
bution of time constants that closely mimicked behavior previously observed in
living cells (18) (Figure 3). Similar results were obtained for other types of load-
ing and for tensegrity structures of higher complexity (64). However, better re-