Biomedical Engineering Reference
In-Depth Information
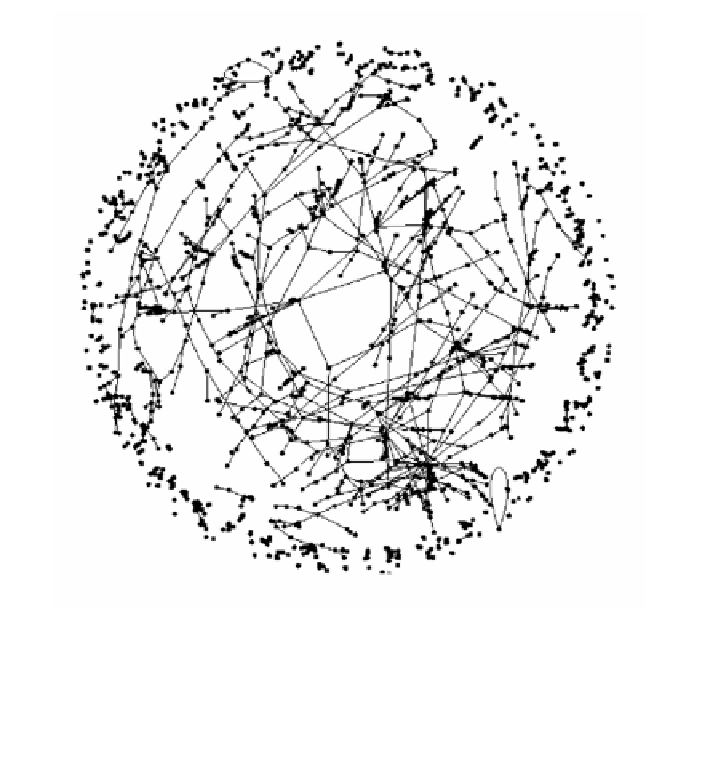
Figure 4
. A graph-based representation of the protein interaction network of the yeast
Sac-
charomyces cerevisiae
. Nodes in the graph correspond to proteins. Black lines connect protein
pairs for which at least one of three sources of empirical data (18,22,30) indicates that the
proteins physically interact.
3.4. The Complexity of Protein Interaction Networks
It comes as no surprise that the above techniques to identify protein interac-
tions and protein complexes, especially those techniques that can already be
applied on a genome-wide scale, reveal protein interaction networks of great
complexity. Figure 4 shows an example of such a network in the yeast
Sac-
charomyces cerevisiae
, as defined by yeast two-hybrid data (18,30) and manu-
ally curated protein interaction data (22). This network comprises 1893 proteins
and 2364 pairwise interactions. Similar networks in higher organisms are even
larger in size. For example, a recently published protein interaction map of the
fruit fly
Drosophila melanogaster
involves 7048 proteins and 20,405 interac-
tions (14). (These numbers do not represent accurate estimates of the number of
protein interactions in vivo, because of some shortcomings of the technique to
identify protein interactions cited above.)