Biomedical Engineering Reference
In-Depth Information
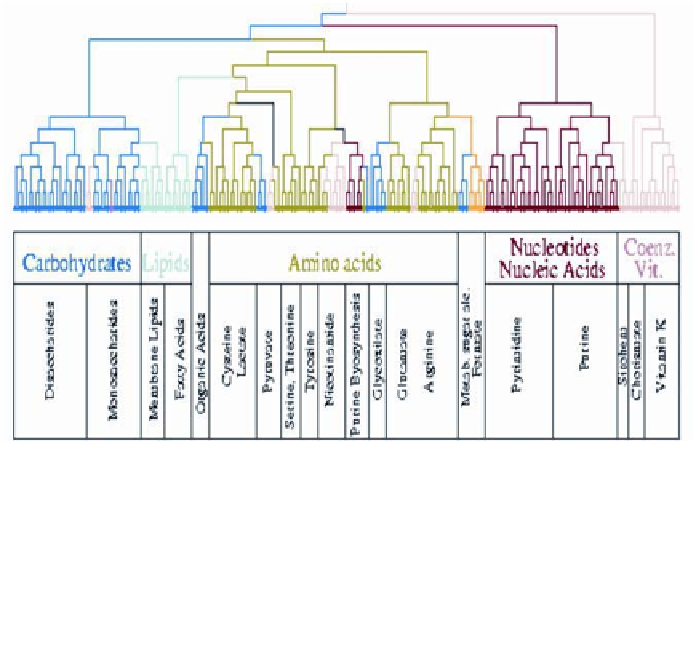
Figure 6
. Hierarchies of topological modules in
E. coli
metabolism. The branches of the
tree obtained by average-linkage clustering of the topological overlap of metabolites (47)
are color-coded to reflect the predominant biochemical classification of their substrates.
The biochemical classes represent carbohydrate metabolism (blue); nucleotide and nucleic
acids metabolism (red); protein, peptide, and amino acid metabolism (green); lipid metabo-
lism (cyan); aromatic compound metabolism (dark pink); monocarbon metabolism (yel-
low), and coenzym metabolism (light orange) (39).
scales from 0 to 1, reflecting the degree to which two metabolites
i
and
j
interact
with the same substrates. Substrates that are part of larger metabolic modules
appear to have a high topological overlap with their neighbors. The application
of average-linkage clustering to the obtained overlap matrix has been used to
uncover the topological modules present in the metabolism (Figure 6). The clus-
tering identified a hierarchy of nested topological modules of increasing size and
decreasing interconnectedness. The hierarchical tree offers a breakdown of the
metabolism into several large modules that are further partitioned into smaller
but more integrated submodules, reflecting a certain degree of inherent self-
similarity. Some of these modules have been found to be in excellent agreement
with the known functional classification of metabolites. Other approaches to
discern modules in metabolic networks focused on the appearance of edges in
mutual shortest paths within the network (18,21). The most frequent edges were
identified and removed in an iterative manner, uncovering again the underlying
functional modules.
Finally, modularity is not an exclusive property of the metabolism. Indeed,
the protein interaction network of
S. cerevisiae
(66), based on four independent