Biomedical Engineering Reference
In-Depth Information
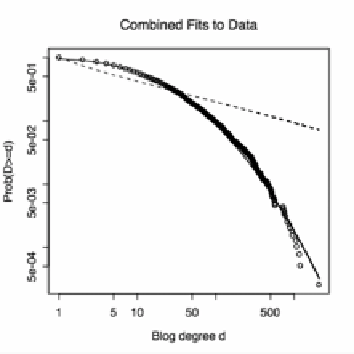
Figure 8
. Maximum likelihood fits of log-normal (solid line) and power law (dashed line)
distributions to the data from Figure 7 (circles); axes as in that figure. Note the extremely tight
fit of the log-normal over the whole range of the curve, and the general failure of the power-
law distribution.
thermodynamics of the system, how it responds to fluctuations, how easy it is to
control, etc. A good complexity measure, in other words, is one which is
relevant
to many other aspects of the system measured. A bad complexity
measure lacks such relevance; a really bad complexity measure would be
positively misleading, lumping together things with no real connection or
similarity just because they get the same score. My survey here has focused on
complexity measures that have some claim to relevance, deliberately avoiding
the large number of other measures which lack it (216).
9.
GUIDE TO FURTHER READING
9.1. General
There is no systematic or academically detailed survey of the "patterns" of
complex systems, but there are several sound informal discussions: Axelrod and
Cohen (218), Flake (219), Holland (220), and Simon (221). The topic by Simon,
in particular, repays careful study.
On the "topics," the only topics I can recommend are the ones by Boccara
(222) and Flake (219). The former emphasizes topics from physics, chemistry,
population ecology, and epidemiology, along with analytical methods, espe-
cially from nonlinear dynamics. Some sections will be easier to understand if
one is familiar with statistical mechanics at the level of, e.g., (200), but this is