Biomedical Engineering Reference
In-Depth Information
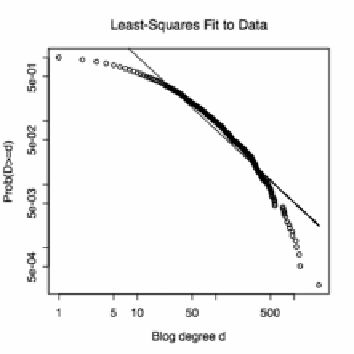
Figure 7
. Empirical distribution of the in-degrees of political weblogs ("blogs"). Horizontal
axis: number of incoming links
d
; vertical axis: fraction of all blogs with at least that many
links, Pr(
D
d
); both axes are on a log-log scale. Circles show the actual distribution; the
straight line is a least-squares fit to these values. This does not produce a properly normalized
probability distribution but it does have an
R
2
of 0.898, despite the clear concavity of the curve.
easy to describe. (Say what one level looks like, and then add that all the rest are
the same!) Wolpert and Macready's measure of self-dissimilarity is, in turn,
closely related to a complexity measure proposed by Sporns, Tononi, and
Edelman (212-214) for biological networks, which is roughly the amount of
information present in higher-order interactions between nodes which is not
accounted for by the lower-order interactions. Badii and Politi (10) propose a
number of further
hierarchical scaling complexities
, including one that
measures how slowly predictions converge as more information about the past
becomes available. Other interesting approaches include the
information
fluctuation
measure of Bates and Shepard (215), and the predictability indices
of the "school of Rome" (216).
8.6. Relevance of Complexity Measures
Why measure complexity at all? Suppose you are interested in the patterns
of gene expressions in tumor cells and how they differ from those of normal
cells. Why should you care if I analyze your data and declare that (say) healthy
cells have a more complex expression pattern? Assuming you are not a
numerologist, the only reason you
should
care is if you can learn something
from that number—if the complexity I report tells you something about the