Biomedical Engineering Reference
In-Depth Information
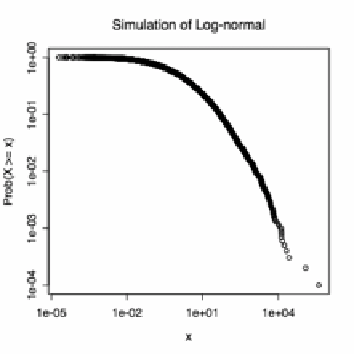
Figure 5
. Distribution of 10,000 random numbers, generated according to a log-normal distri-
bution with
E
[log
X
] = 0 and
)
(log
X
) = 3.
Figure 6. One might hope that it would be easy to tell that this data does not
come from a power law, since there are a rather large number of observations
(5,112), extending over a wide domain (more than four orders of magnitude).
Nonetheless,
R
2
is 0.962. This, in and of itself, constitutes a demonstration that
getting a high
R
2
is not a reliable indicator that one's data was generated by a
power law.
29
An Illustration: Blogging
. An amusing empirical illustration of the diffi-
culty of distinguishing between power laws and other heavy-tailed distributions
is provided by political weblogs, or "blogs"—websites run by individuals or
small groups providing links and commentary on news, political events, and the
writings of other blogs. A rough indication of the prominence of a blog is pro-
vided by the number of other blogs linking to it—its
in-degree
. (For more on
network terminology, see Part II, chapter 4, by Wuchty, Ravasz and Barabási,
this volume.) A widely read essay by Shirky claimed that the distribution of in-
degree follows a power law, and used that fact, and the literature on the growth
of scale-free networks, to draw a number of conclusions about the social organi-
zation of the blogging community (207). A more recent paper by Drenzer and
Farrell (208), in the course of studying the role played by blogs in general politi-
cal debate, re-examined the supposed power-law distribution.
30
Using a large
population of inter-connected blogs, they found a definitely heavy-tailed distri-
bution which, on a log-log plot, was quite noticeably concave (Figure 7); none-
theless,
R
2
for the conventional regression line was 0.898.