Graphics Programs Reference
In-Depth Information
BB
i
K
i
idleM
i
IB
i
busyM
i
OB
i
enterCell
i
inM
i
outM
i
exitCell
i
repair
i
OK
i
FAILED
i
failure
i
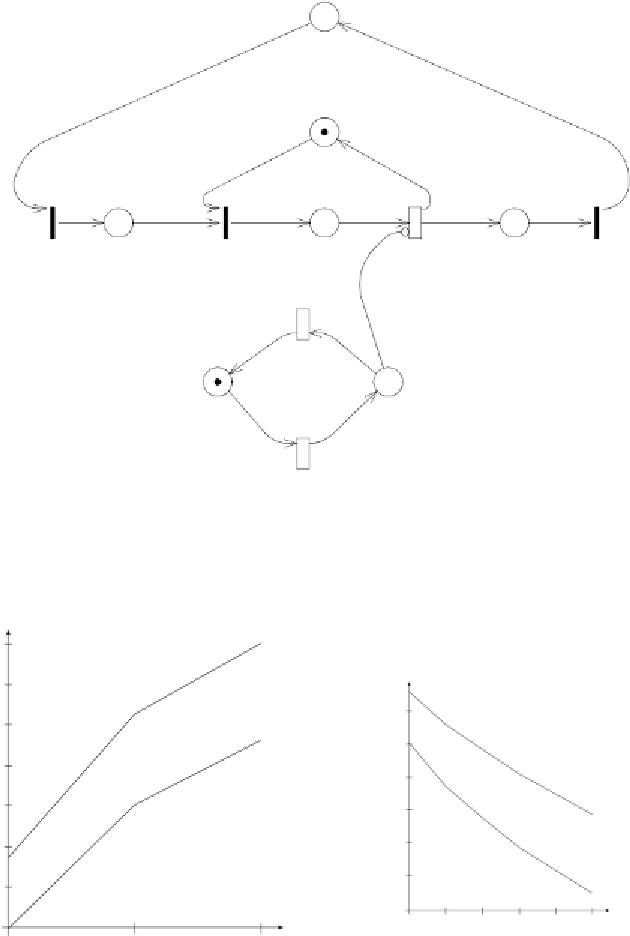
Figure 8.4: Model of a Kanban cell that can fail
Throughput
Failure
free system
3.00
Relative Throughput
Reduction
2.80
0.040
Failure
prone system
2.60
0.038
2.40
Failure in
middle cell
0.036
2.20
0.034
2.00
0.032
Failure in
last cell
0.030
1.80
0.028
1.60
1
2
3
4
5
6
K
1
2
3
K
Figure 8.6: Throughput comparison
between a middle failing cell and a
final failing cell (percentage reduc-
tion), as a function of the number of
cards
Figure 8.5: Throughput comparison
between a failure free system and a
system in which all cells can fail, as a
function of the number of cards
Search WWH ::

Custom Search