Environmental Engineering Reference
In-Depth Information
accompanied by the higher concentration of oxygen vacancies [25]. h ese
surface defects may serve as trapping/scattering centers for conduction elec-
trons. At er annealing in air and O
2
atmosphere, the amorphous layer associ-
ated with oxygen defects is partially depleted and the surface barrier shrinks,
leading to an increase in conductivity. To correlate this change in electrical
conductivity with defects, PL measurements of the same three samples were
performed and it was found that a huge reduction in defect band occurred
at er annealing. Gaussian i tting of 3 peaks named as I
G
(green defect), I
Y
(yellow defect), and I
R
(red defect) is carried out in an unstructured broad
defect peak to i nd the type of defects. h e intensity of green emission is
drastically suppressed at er annealing compared with other emissions,
which shows that the green defects (i.e., single-charged oxygen vacancies)
are mainly responsible for the poor dark conductivity [25].
h e surface of ZnO nanowire i lm changes from hydrophobic (96
°
)
to hydrophilic (16
) and improvement in crystal quality of the nanowire
is observed under oxygen annealing. h e defect band emission intensity
(relative to band edge emission, I
D
/I
UV
) reduces from 1.3 to 0.2 at er anneal-
ing at 600
°
C at 10 SCCM l ow of oxygen, and results in an order enhance-
ment in dark conductivity. Annealing in various other gas atmospheres
strongly af ects the defect concentration of nanowire i lms and resulting
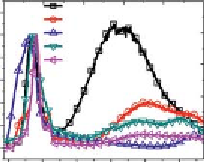
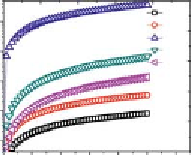
change in electrical conductivity. Figure 16.7 demonstrated such a result,
where nitrogen and argon annealing leads to good control on defect band
emission, while hydrogen annealing results in fully suppressed defect band
intensity. h e electrical conductivity is also increased; argon leads to a one-
order increase and nitrogen leads to around a two-order increase in electri-
cal conductance of the i lm. However, surprising results were obtained in
hydrogen annealed nanowire i lms. More than a four-order increment was
noted in electrical conductance of i lm, which is also found stable for years.
°
ASG
O2
H2
N2
Ar
ASG
O2
H2
N2
Ar
10
-2
10
-3
10
-4
10
-5
10
-6
012 3456
Voltage (V)
350
420
490
560
630
700
(
b
)
(
a
)
Wavelength (nm)
Figure 16.7
(a) Room temperature PL measurements of ZnO nanowire i lms annealed
in oxygen, nitrogen, argon and hydrogen ambience; (b) Dark conductivity of respective
samples.
Search WWH ::

Custom Search