Environmental Engineering Reference
In-Depth Information
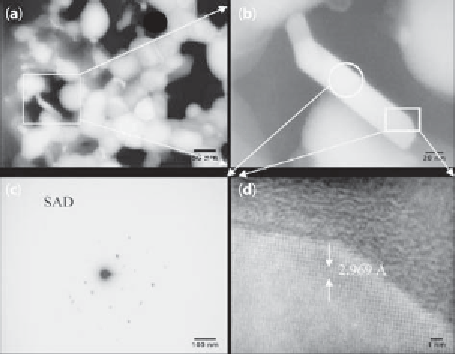
Figure 15.14
TEM images of NiMoO
4
-doped Bi
2
Ti
4
O
11
nanocomposite: (A) bright i eld
(BF) pattern, (B) highlighted particle from (A), (C) SAD pattern of the particular particle,
and (D) particle distribution or arrangement by high resolution.
1.6
1.4
1.2
1.0
0.8
0.6
NM
x
BT
1-X
(X = 0.01)
NM
x
BT
1-X
(X = 0.05)
NM
x
BT
1-X
(X = 0.1)
NiM
O
O
4
Bi
2
Ti
4
O
11
TiO
2
0.4
0.2
0.0
-0.2
300
350 400
Wavelength (nm)
450
500
550
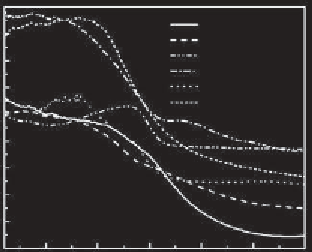
Figure 15.15
h e UV-Vis dif uses rel ectance spectra of NM
x
BT
1-x
(x = 0.01, 0.05, 0.1)
composites, NiMoO
4,
Bi
2
Ti
4
O
11
and
TiO
2
.
NM
x
BT
1−x
(x = 0.01, 0.05, 0.1) composite are determined to be 439, 424 and
409 nm, corresponding to the band gap energy of 2.82, 2.92 and 3.03 eV,
respectively [89]. Similarly, the band gap absorption edge of NiMoO
4
and
Bi
2
Ti
4
O
11
is determined to be 441 and 382 nm, and the corresponding band
gap energies are 2.81 and 3.24 eV. A mechanistic scheme of the charge
separation and the photocatalytic activity for the photocatalysts is shown
Search WWH ::

Custom Search