Environmental Engineering Reference
In-Depth Information
10
PF
UP
PF: y = -0.8596x + 5.0557
R
2
= 0.4098
UP: y = -0.8604x + 5.1257
R
2
= 0.4183
8.19 a
8
6
4
2
0.87 b
0.79 c
0.53 d
0.49 d
0.44 d
0.48 d
0.75 b
0.63 c
0.46 d
0.41 d
0.42 d
0.46 d
0
Control
1000
900
800
700
600
500
Impregnation pressure (mmHg)
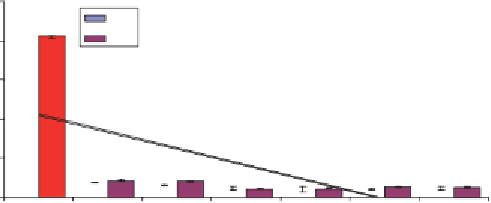
Figure 5.3
MC of PF- and UP-impregnated sugar palm i bers at various impregnation
pressures.
observed when pressure increased from 700 and 500 mmHg. It was also
observed that the rate of moisture absorption was not much dif erent
between PF-impregnated i bers and UP-impregnated i bers, as shown by
the slope in the respective regression trend lines.
It was expected that the i ber without impregnation would have much
higher MC due to absorption of moisture into its cell wall. h is can be
attributed to the hydrophilic property of natural i bers where hydrogen
bonding is formed between the hydroxyl groups and water molecules
[31-34]. h is is due to the fact that natural i ber contains hydroxyl or OH
groups, which are present throughout its structure and attract and hold
water molecules by the mechanism of chemical bonding called hydrogen
bonding. When natural i bers are exposed to a surrounding atmosphere
containing high humidity, initially water molecules are absorbed directly
onto the hydrophilic groups of the i ber, followed by other water molecules
attracting to other hydrophilic groups; they also may form further layers
on top of the water molecules that have already been absorbed [35]. h is
absorption continues until the equilibrium moisture content (EMC) with
the surrounding air is attained. h is study has successfully proven that the
penetration of moisture and the formation of hydrogen bonds are inhib-
ited by enclosing the i ber with hydrophobic materials of polymer resin via
a i ber-resin impregnation process. With impregnation and polymeriza-
tion, the natural i bers became moisture resistant as they were enclosed
with cured resin that would expel moisture from the i ber. h is can be bet-
ter understood by observing the optical micrographs (400x) (Figs. 5.4a-g)
that show the i bers enclosed with the resin at er being impregnated. h e
surface of the control sample (Fig. 5.4a) was signii cantly dif erent than the
surface of the UP-impregnated i bers (Figs. 5.4b-g).


Search WWH ::

Custom Search