Environmental Engineering Reference
In-Depth Information
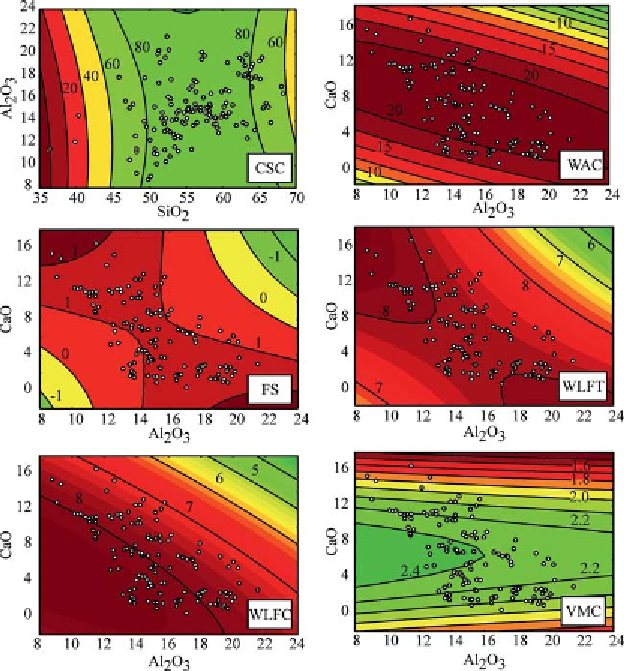
Figure 4.2
ANN prediction performance for
CSC, WAC, FS, WLFT, WLFC
and
VMC
(MLP 10-13-10).
model (MLP 10-13-10, No 4) gained: 0.902, 0.879, 0.963, 0.962, 0.973,
0.839, 0.984, 0.987, 0.987, and 0.913, respectively, during the testing period.
4.3.5 SensitivityAnalysis
In order to access the ef ect of changes in the output due to the change in
the input, a sensitivity analysis was performed. h e greater ef ect observed
in the output means greater sensitivity presented with respect to the input
[31]. h e white noise signals were incorporated by adding or subtracting a
Gaussian error of SD = 5% and zero mean with 98% probability [20], i.e.,
2.241·SD to each input variable. h e white noise was normally distributed
Search WWH ::

Custom Search