Geology Reference
In-Depth Information
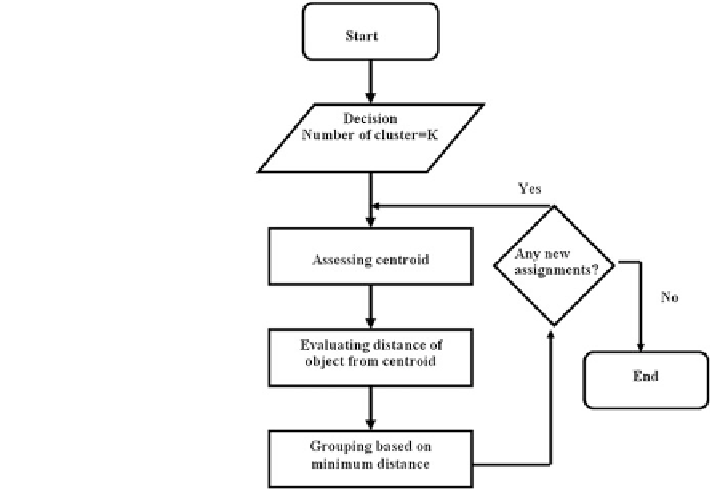
Fig. 3.5 Simple
flow chart of
the K-means clustering
algorithm
1. When the amount of data is at a minimum, the initial assumption will have a
signi
uence on the clustering
2. Being sensitive to the initial conditions, the algorithm has a high chance of
becoming trapped in a local optimum
3. Weights of attributes: the assumption is each attribute has the same weight
4. The method is based on distance: the results are therefore mostly circular cluster
shape
5. Weakness of centroid calculation: a single highly erroneous data from the
centroid may pull the centroid much further from the real one.
cant in
However, the application of the K-means clustering approach is enormous, and
one can
find successful applications of this technique in the unsupervised learning
of neural networks, pattern recognition, arti
cial intelligence, image processing,
machine vision, economics, and many more.
3.4.2.1 Silhouette Value
The silhouette value S(i) was de
ned as the indicator of dissimilarity between
clusters. Assume any object i in the data set and this object belong to cluster A.If
the cluster A contains objects apart from i, we can calculate a(i), the average
dissimilarity of i to all other objects of A.