Geology Reference
In-Depth Information
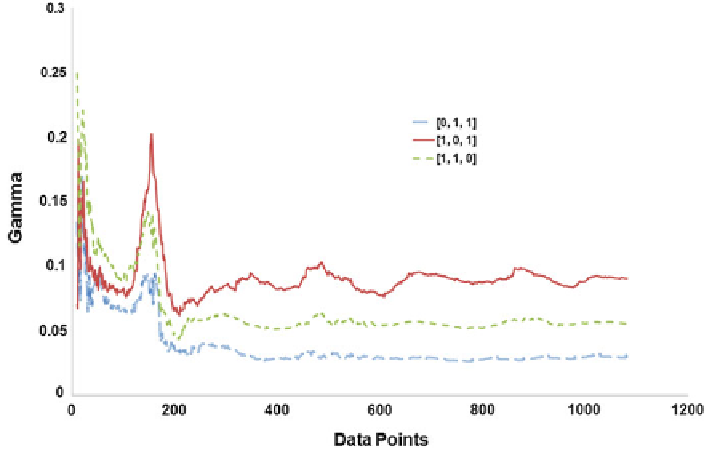
high degree of predictability of the given output using the selected feature. At the
same time, the higher value of gradient shows the complexity of the selected feature
to make a model. This allows the researcher to reach a reliable conclusion on model
data selection. The selection of the best inputs can be explained through Fig.
3.2
.In
Fig.
3.2
, the Gamma statistic values decrease in value when we remove the data
series x
1
and Gamma values are high when we remove the data series x
2
. This
indicates that the predictability of the smooth model is better for the [0, 1, 1] masked
data subset. In other words, the removal of the series x
1
did not greatly in
uence the
Gamma static value, whereas the removal of data series x
2
made a large impact on
the Gamma values. When we masked the series x
2
, the predictability of the series
was considerably reduced (higher Gamma and V-ratio). So, from Fig.
3.2
one can
easily see that the in
uence of input data being modeled is in the form of x
2
> x
3
> x
1.
This technique has received attention among researchers working in the eco-
nomics and environmental
field in recent years. Connellan and James [
17
] and
James and Connellan [
39
] have used the Gamma Test to predict short time property
prices based on the time series valuations and 15-year gilts. Oliveira [
55
] has
demonstrated the capability of this technique to extract a digital signal masked by a
chaotic carrier. Corcoran et al. [
18
] applied the GT as a method for crime incident
forecasting by focusing upon geographical areas of concern which transcend tra-
ditional policing boundaries. This topic has identi
ed the great potential and
effectiveness of this technique in hydrology in being used for water management,
including flood prediction and other hydrological nonlinear modeling.