Geology Reference
In-Depth Information
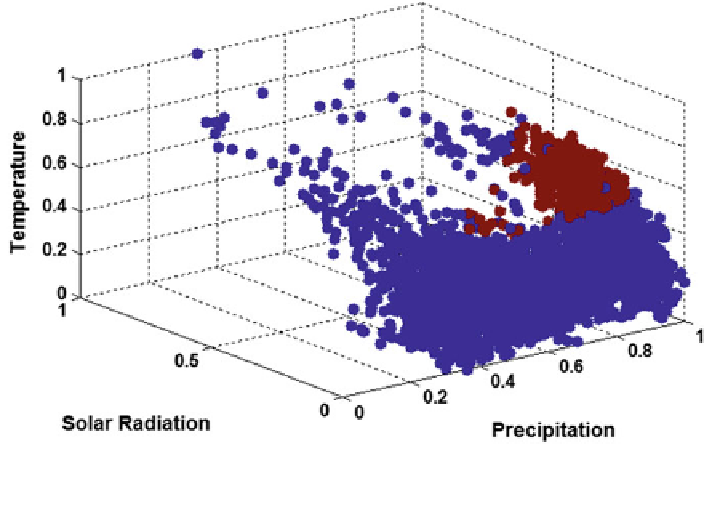
Fig. 8.9 Statistical blockade classification of Monte Carlo generated samples at 90 % threshold
value. The brown color shows flood values that fall in the extreme tail region
dots correspond to the
'
non-tail region
'
data and brown dots correspond to the
'
tail
region
of the discharge data for a threshold value of 90%.
The modeling capabilities of SB have been assessed by comparing with those of
the ANN and SVM models in predicting the number of
'
flows which could
exceed a range of threshold values. The percentage changes in the number of
ood
ood
events predicted by the different models are shown in Fig.
8.10
, based on the
training data sets.
The figure indicates that Standard Blockade has higher capabilities to predict the
peak values exceeding selected threshold values of
flood exceedance. However, it is
interesting to note that ANN has a better performance than SVM in this particular
case study. Results suggest that the performance of SB is comparable to that of the
ANN model in predicting the number of
flood events falling above a threshold
value at 90 and 80 %. The SB has outperformed the ANN towards the lower limits
(70 %) and higher limits (90 %) of the threshold. The high error values of the SVM
model can be related to the underestimation of the model during monsoon seasons.
This highlights the fact that the SVM model requires much better tuning of its
parameters for getting an improved performance. The GPD CDF generated in our
case study for different peak values is shown in Fig.
8.11
. This graph could generate
meaningful information about the tail region of the discharge in the study area.
The modeling details of ANNs and SVMs in predicting numbers of peaks
predicted above a modeler selected threshold value are given subsequently.