Geology Reference
In-Depth Information
Table 7.10 Modelling attributes and overall model utility for different models in daily
evaporation modeling
Model
Complexity
(function of
modelling
time)
Sensitivity
(function
of Slop of
sensitivity
curves)
RMSE
(mm/
day)
RMSE
(relative
fraction
of higher
value)
Sensitivity
(relative
fraction of
higher
value)
Utility
(U)
ANN-
LM
0.906907
0.469091
31
1.29
3.02
0.278014
NW
0.783784
0.501818
179
1.38
2.61
0.34192
ANFIS
0.888889
0.767273
89
2.11
2.96
0.16969
W-
ANFIS
0.828829
0.8
434
2.2
2.76
0.185458
SVM
1
0.694545
389
1.91
3.33
0.139072
W-SVM
0.894895
1
1,251
2.75
2.98
0.051096
NNARX
0.993994
0.476364
35
1.31
3.31
0.220594
LLR
0.827327
0.472727
28
1.3
2.755
0.326226
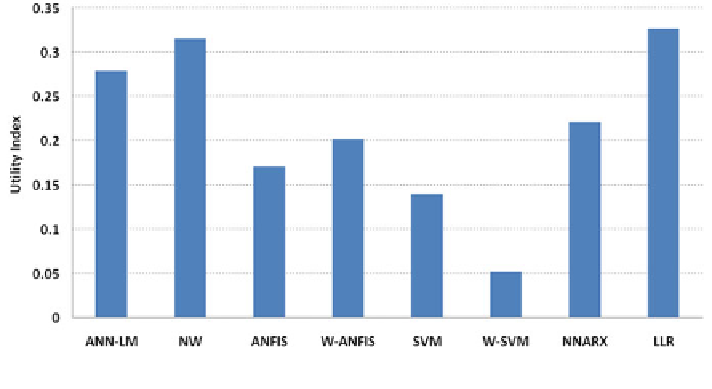
Fig. 7.41 Overall model utility
—
case study: evaporation modeling
simpler model LLR could perform signi
cantly well in evaporation modeling with
a U value of 0.326. The LLR model had a consistent performance throughout the
three case studies in this topic. Because of the relatively high sensitivity and
modeling time of the SVM and W-SVM models, those two models gave the lowest
utility index values. Even though the sensitivity of the ANFIS was less than that of
the W-ANFIS, the utility value for W-ANFIS is found to be higher because of its
consistency in modeling error during training and validation. The failure of
W-SVM indicates that not necessarily all complex model gives useful predictions.
Complex models may stand out in
'
better and more useful
'
model groups if they fail