Geology Reference
In-Depth Information
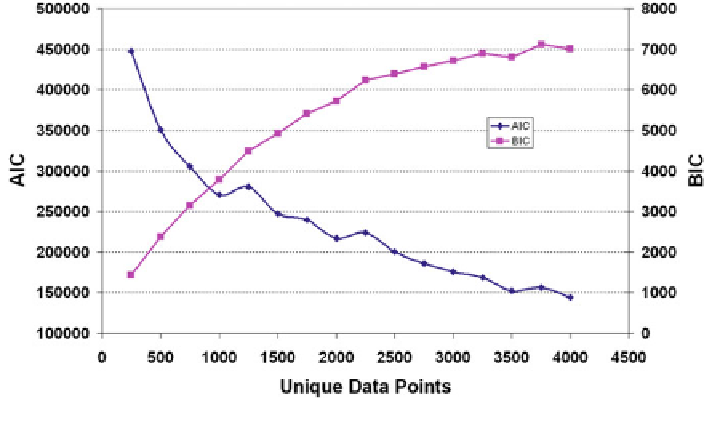
Fig. 7.26 Variation of AIC and BIC with increase in data points in evaporation modeling
note that both AIC and BIC identi
ed relative humidity (RH) as the least in
u-
encing input. This
finding is perfectly matched with entropy theory and GT analysis
based on complexity/error. The analyses using these information criteria were
continued for different input combinations (scenarios 5
9 in Table
7.7
). It has found
that the combination [W, T, Ed] is the better model. This
-
finding again is in line
with the suggestion made by entropy theory. AIC and BIC con
rm [W, T, Ed] as
the best model out of the three models suggested by GT because of its better
(minimum) numerical values of information criterion, with values of 201, 719.1,
and 8,377.06, respectively.
The AIC and BIC were applied to identify the optimum data length for training.
This was performed with the help of an LLR model with an increase in training data
points. The LLR model construction was performed with different training data
lengths (namely, training data points 500, 1000, 1500, 2000, 2500, 3000, 3500, and
4000) with the best selected input structure [W, T, Ed]. The variation of AIC and
BIC with increase in training data length is shown in Fig.
7.26
. It has been found
that the AIC value decreased with increase of data points and the BIC value
increased with increase of data points in training. In the curve, there was no definite
local minimum to specify the required minimum number of data for training.
However, it is noted that the curves have a distinct change at 3,500 data points. It is
also found that the AIC value is relatively stable after the 3,500 data position.
However, the Gamma Test identi
ed the optimum data required for the model as
2327, which was nowhere near the suggested 3,500.

