Geology Reference
In-Depth Information
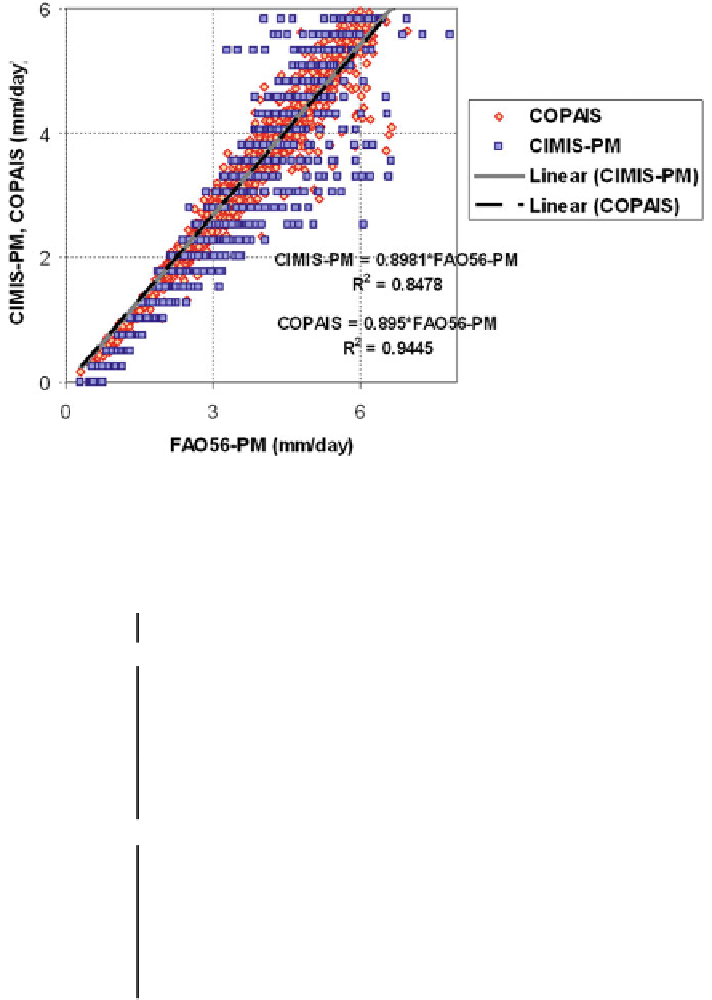
Fig. 7.12 Daily reference evapotranspiration comparison of the CIMIS-PM ET
0
and the Copais
Approach equation with the FAO56-PM ET
0
at Santa Monica Station during 2000
2002
-
Table 7.4 Summary statistics of daily ET
0
estimation of different methods and ANN modeled
results tested against the reference method (FAO56-PM method)
Method
R
2
S
2
Mean ET
0
(mm/day)
Slope
MBE (mm)
Brue catchment, daily estimations (1995)
FAO56-PM
1.68
ASCE-PM
0.013
0.0015
−
1.67
0.99
0.99
CIMIS-PM
0.014
0.378
1.70
1.12
0.92
COPAIS
0.688
0.271
1.01
1.15
0.90
−
ANN
0.018
0.012
−
−
1.67
0.99
0.97
Santa Monica Station, daily estimation (2000
-
2002)
FAO56-PM
3.84
ASCE-PM
-
-
3.84
1.00
1.00
CIMIS-PM
0.458
0.356
−
3.41
0.898
0.85
COPAIS
−
0.429
0.113
3.38
0.895
0.94
ANN
0.011
0.091
3.82
0.93
0.92
−
different methods in comparison with FAO56-PM method at these sites is given in
Table
7.4
.
As mentioned earlier, another daily ANN model was developed for the Beas
basin using weather parameters such as solar radiation, maximum and minimum air