Geology Reference
In-Depth Information
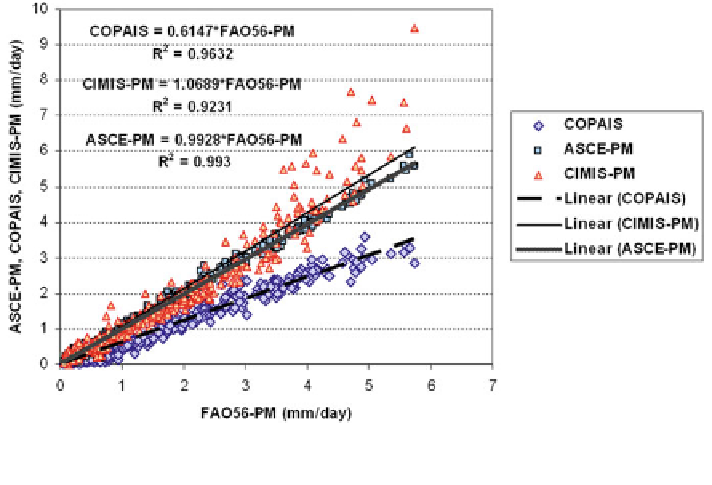
Fig. 7.11 Daily reference evapotranspiration comparison of ASCE-PM ET
0
, CIMIS-PM ET
0
, and
Copais with FAO56-PM ET
0
at the Brue catchment for the year 1995
Copais Approach against the daily FAO56-PM revealed a very high linear corre-
lation and it signi
cantly underestimated (slope = 0.62 and R
2
= 0.96) the true
value. It is obvious from Fig.
7.11
that daily ASCE-PM performs best with an R
2
value of 0.99 and a slope value of 0.99. RMSD-based daily comparisons were also
performed between the different methods and these values were observed to be
relatively small. The daily comparison of the CIMIS-PM equation with FAO56-PM
exhibited good correlation with an R
2
value of 0.92 with a slight over-prediction
because of some odd values in the month of August. From Fig.
7.11
one can learn
that daily ET
0
values of all the evaluated models, except the Copais Approach, are
quite near to the 1:1 line in comparison with the standard FAO56-Penman
-
Monteith equations. Figure
7.12
shows daily ET
0
comparison plots of the CIMIS-
PM equation and the daily Copais Approach equation with the standard FAO56-PM
equation at Santa Monica Station, California during the study period (January
2000
December 2002).
Just as with the Brue catchment, the daily Copais Approach equation underes-
timates in comparison with the FAO56-PM equation at Santa Monica Station.
Comparison of daily estimations by CIMIS-PM with FAO56-PM has shown rea-
sonably good correlation (R
2
= 0.85) with underestimation (slope = 0.898). The
CIMIS-PM comparison with FAO56-PM is in good agreement with the findings of
Kişi
-
i[
13
]. It would be very interesting to have an idea of the variation of the mean
daily percentage of over/underestimation at these sites. Summary statistics,
including variance and bias of the methods with FAO-PM method, are shown in
Table
7.4
. The percentage variation of the mean daily of over/underestimation of
ş