Geology Reference
In-Depth Information
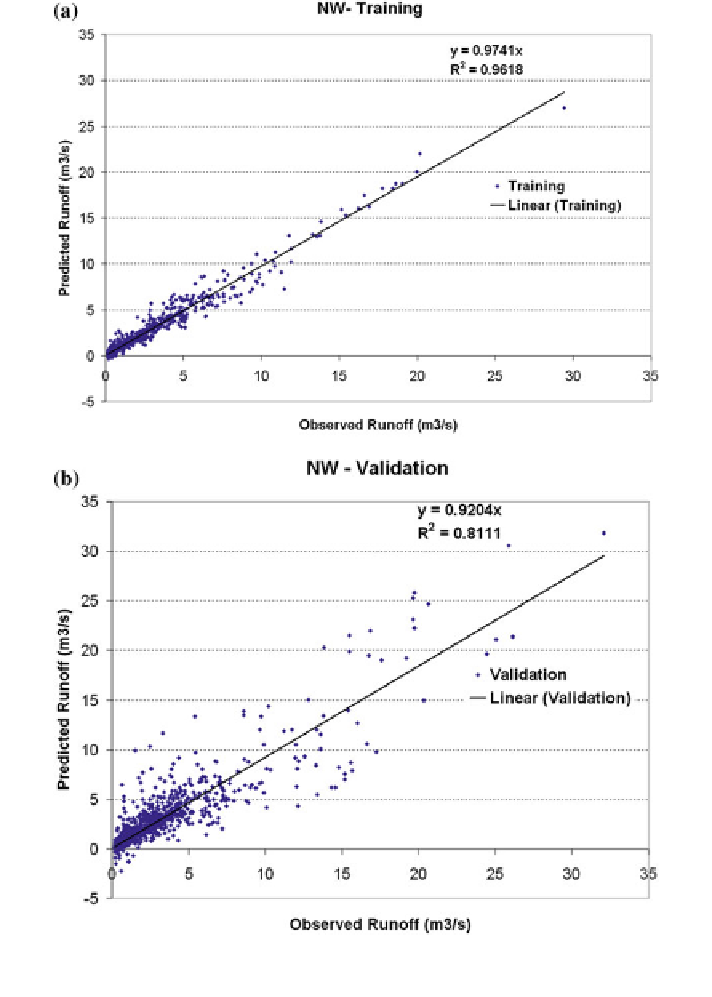
Fig. 6.26 The observed versus the NW model predicted daily runoff at the Brue catchment
a scatter plot of the training data set. b scatter plot of the validation data set