Geology Reference
In-Depth Information
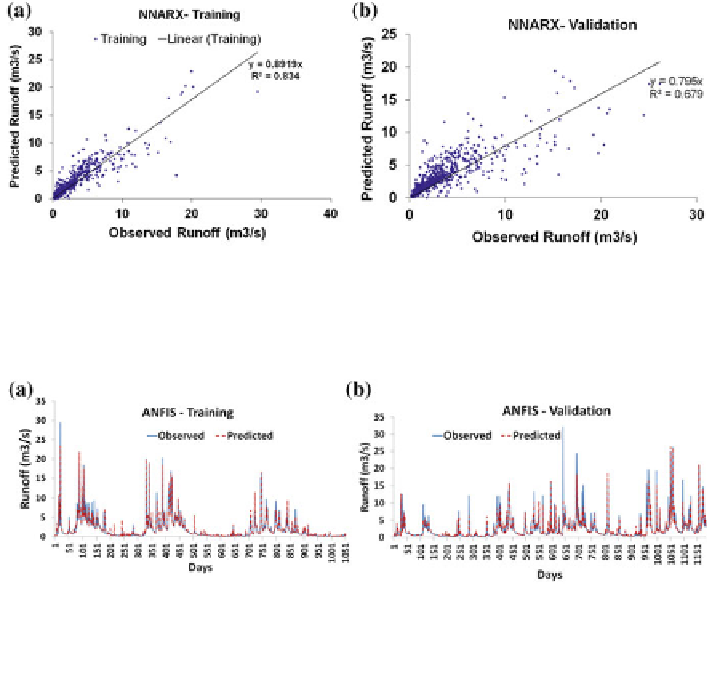
Fig. 6.22 The observed versus the NNARX predicted daily runoff at the Brue catchment a the
training data set. b the validation data set
Fig. 6.23 The observed versus the ANFIS predicted daily runoff at the Brue catchment a the
training data set. b the validation data set
the LLR out performed both NNARX and ANFIS models in both training and
validation phases. The observed and estimated runoff values of NNARX model for
the training data given in Fig.
6.22
a in form of a scatter plot and the corresponding
values for the validation data is given Fig.
6.22
b in a scatter plot. The similar plots
of ANFIS model are given in Fig.
6.23
a, b. The table also included the variation of
evaluation criteria like MBE and Variance of the distribution of differences S
d
about
MBE. These criteria can provide information on the robustness of the model.
Figure
6.24
a shows the time series plot of observed and estimated runoff using the
LLR model for 1,056 data points and corresponding scatter plot of the observed and
predicted runoff values using the LLR model in the validation phase is shown in the
Fig.
6.24
b. The CORR value produced by the LLR model during the training phase
is 0.92 and it is much larger than that of NNARX and ANFIS model. But the
ANFIS model in validation phase presented a larger CORR value than that of the
LLR model, which indicates weakness of the LLR model to reach peak values in
the validation phase.