Geology Reference
In-Depth Information
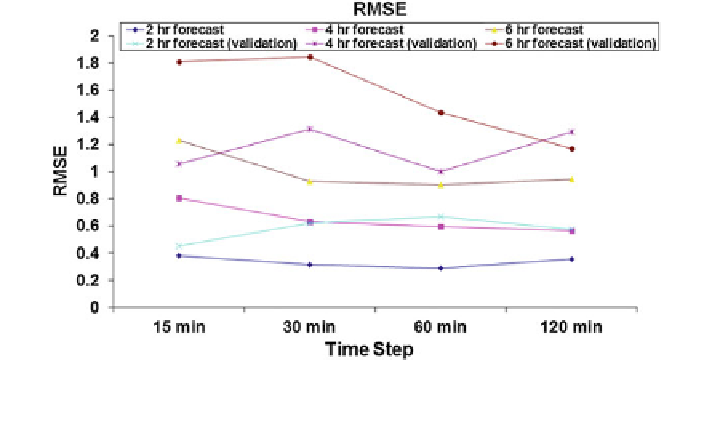
Fig. 6.21 Variation of root mean square error values in multi-step ahead forecasted runoff at the
Brue catchment using different sampling frequency data in both validation and training phase
catchment or the Brue catchment, it has been found that a 30 min interval is the
optimal for rainfall runoff modelling and signi
cance of data frequency is more
prominent in longer lead time modelling.
6.5.3 Data Driven Modelling with LLR, NNARX and ANFIS
The performances analysis of different models used in this case study are shown in
the Table
6.5
in terms indices like CORR, Slope, RMSE, MAPE, MBE, ef
ciency
and Variance of the distribution of differences about MBE, (S
d
). The arti
cial
neural network with Levenberg-Marquardt training algorithm, used for this non-
linear modelling, consists of an input layer with
five inputs equivalent to input
structure of [3, 2] with three antecedent values of daily discharge and two ante-
cedent values of daily precipitation. The inputs are Q(t
1),Q(t
2),Q(t
3),
−
−
−
P(t
ed with the Gamma Test. LLR, NNARX
and ANFIS models are applied to the Brue catchment, using the Gamma Test
identi
1) and P(t)), which have been identi
−
cation data sets. Even though we have used several
data selection approaches, gamma test is considered as the best method for input
training data length selection. In the Table the performance of state of the art
models was compared with the traditional in order na
ed calibration and veri
ve model (in which the
predicted runoff value is equal to the latest measured value) and a trend model (in
which the predicted runoff value is based on a linear extrapolation of the two
previous runoff values). Our study shows that the performance of the ANFIS model
is better than that of the NNARX model. The performance of the NNARX model is
5.45 % less than that of the ANFIS model in the training phase. In terms of RMSE,
ï