Geology Reference
In-Depth Information
Table 6.4 Performance analysis of ARX, ARMAX and different ANN models on daily rainfall-
runoff records from the Brue catchmentBrue catchment
Models
and algorithms
Training data(1056 data points)
Validation data
R
2
R
2
RMSE
(m
3
/s
and
%)
Slope
MBE
(m
3
/s)
RMSE
(m
3
/s
and
%)
Slope
MBE
(m
3
/s)
ARX
1.19
(61.9)
1.35
(57.9)
0.85
0.86
−
0.123
0.79
0.84
−
0.201
ARMAX
0.89
(46.3)
1.20
(51.5)
0.89
0.90
0.081
0.81
0.88
0.115
−
−
ANN
(Conjugate
Gradient)
1.68
(87.5)
2.18
(93.5)
0.69
0.82
−
0.029
0.63
0.83
−
0.119
ANN
(BFGS)
1.33
(67.8)
1.94
(80.1)
0.83
0.88
−
0.156
0.73
0.80
−
0.302
ANN
(Levenberg
-
Marquardt)
1.18
(60.3)
1.4401E
−
05
1.43
(58.7)
0.84
0.89
0.76
0.87
−
0.042
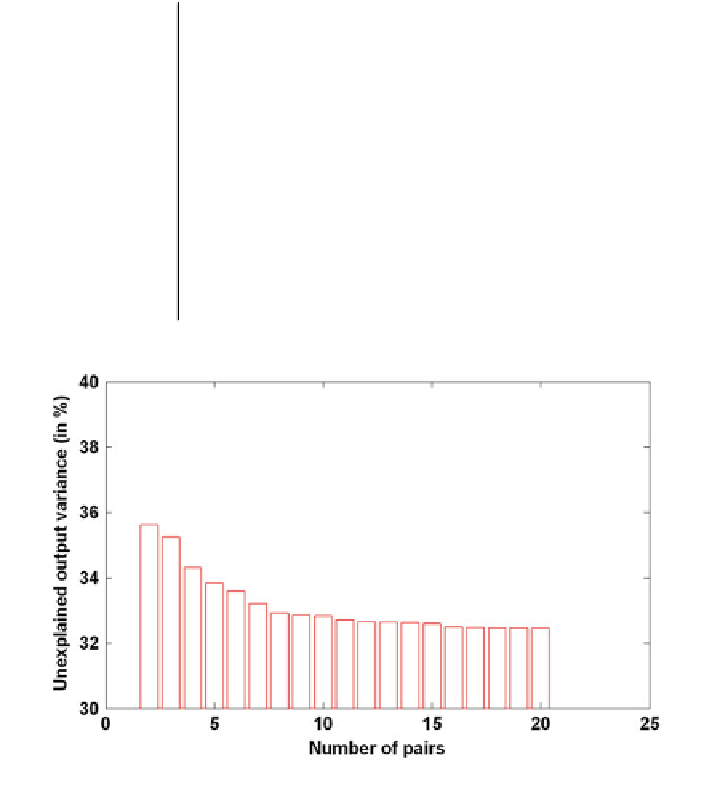
Fig. 6.13 The order selection for ARMAX model
The set of co-ef
cient associated with the ARX and ARMAX models were esti-
mated using the least squares (LS) algorithm.
The RMSE statistic measures the residual variance and the optimal value is 0.0.
The ARMAX models tend to have the smallest RMSE during both calibration and
validation compared to the ANN models used. The RMSE value of the ARX model
was comparable to that of the best performed ANN model (Levenberg
Marquardt
Type). The Conjugate Gradient ANN models have the worst RMSE during cali-
bration and validation.
The correlation (CORR) statistic and slope measures the linear correlation
between the observed and simulated
-
flows; the optimal value is 1.0. The CORR