Geology Reference
In-Depth Information
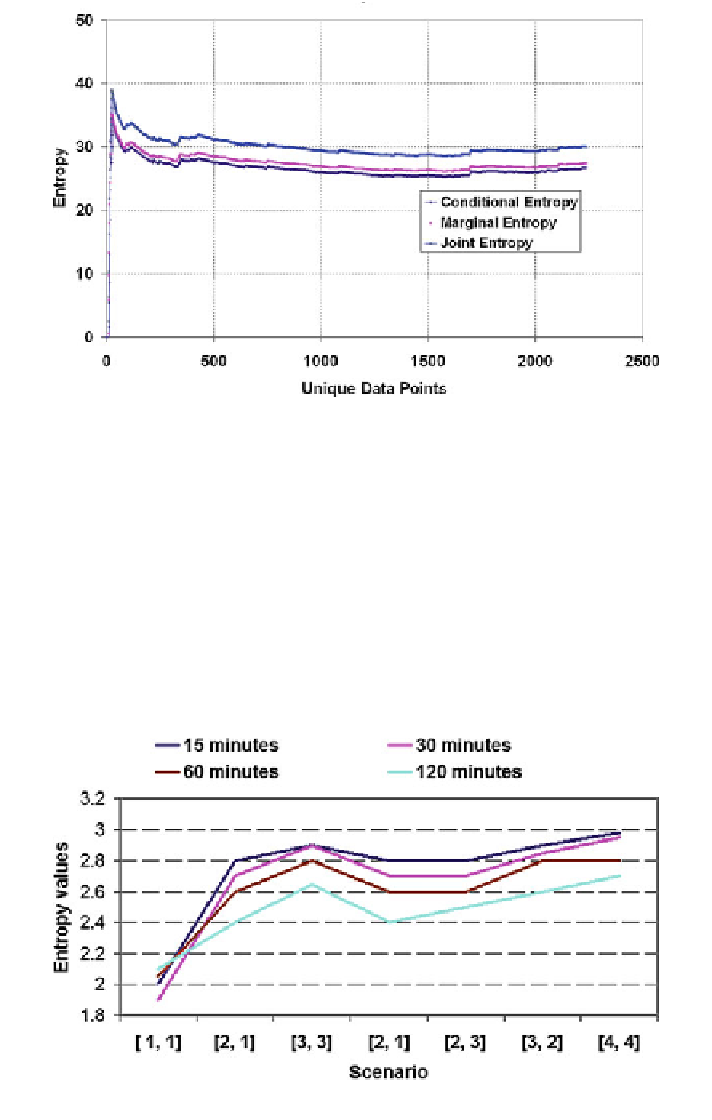
Fig. 6.7 Variation of different entropy values in daily rainfall runoff modelling Rainfall runoff
modelling
Entropy Theory (ET) was also used to identify the best embedded input com-
bination for rainfall-runoff records with different sampling intervals from the Brue
catchment. The combination with higher entropy information (potentially better
predictability) was identi
ed for different data intervals of 15, 30, 60 and 120 min.
The variation of entropy information with different major input combinations is
shown in Fig.
6.8
. It can be found that the 15 min data is the best for the modelling
and also we can observe that the entropy information for 30 min data is close to that
of the 15 min data for most of the combinations. The entropy theory identi
es the
Fig. 6.8 Entropy information variation corresponding to major input combinations for different
data intervals [
18
]