Geology Reference
In-Depth Information
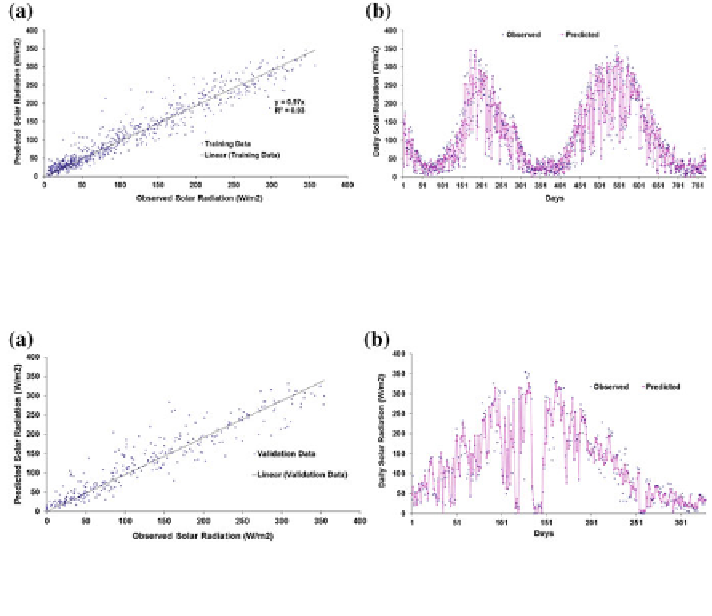
Fig. 5.38 Solar radiation as observed and estimated using the NW model for the training data set.
a scatter plot, b line diagram
Fig. 5.39 Solar radiation as observed and estimated using the NW model for the validation data
set. a scatter plot, b line diagram
ciency of the NW model is 5.05 % higher than that of the
ANFIS model for the training data and the corresponding value for the validation
data is 26.6 % higher. Compared with the W-SVMmodel, the ef
The performance ef
ciency values of the
NW model are 9.44 % and 24.05 % higher for the training and validation data
respectively. The ef
ciency of W-ANFIS observed less than that of ANFIS model.
One justi
cation for this higher performance could be the over estimation of ANFIS
and the positive bias of ANFIS with a numerical value of 0.0003 W/m
2
. The sta-
tistical indices have shown that the use of wavelet decomposition made an adverse
effect on ANFIS model. MAPE values of NW are found to be 0.115 W/m
2
and
0.070 W/m
2
during the training phase and validation phase respectively; the corre-
sponding values for both the W-SVM and W-ANFIS models are found to be higher
for both the validation and training phase with values 0.215, 0.189, 0.104 and
0.106 W/m
2
respectively. In terms of MBE and S
2
, the performance of the NWmodel
outperforms all other tested models in both the training and validation phases. The
observed and estimated daily solar radiation values of W-SVMmodel for the training
data are given in Fig.
5.40
a in form of a scatter plot and corresponding values in the
form of the line plot are given in Fig.
5.40
b for better understanding. The observed
and estimated daily solar radiation values of W-SVM model for the validation data
are given in Fig.
5.41
a, b in form of a scatter plot and line diagram. The RMSE value