Geology Reference
In-Depth Information
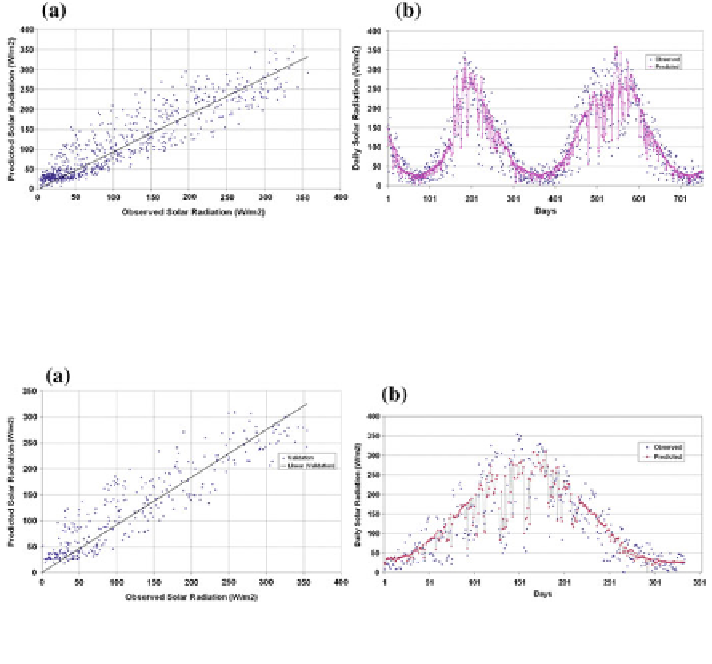
Fig. 5.26 Solar radiation as observed and estimated using the ANN model with BFGS algorithm
for the training data set. a scatter plot, b line diagram
Fig. 5.27 Solar radiation as observed and estimated using the ANN model with BFGS algorithm
for the validation data set. a scatter plot, b line diagram
and validation phases (RMSE value of 30.39 W/m
2
(26.9 % of mean observed solar
radiation) and MBE value of
0.222 W/m
2
during validation phase) It was seen that
−
the LLR model
s performance had a superior performance compared with BFGS,
conjugate gradient and Levenberg
'
Marquardt ANN models.
From Figs.
5.23
,
5.24
,
5.25
and
5.26
, one can
-
find that ANN based models are
struggling to reproduce the highest values. In the same time the LLR model is free
from this handicap [
18
]. The comparative analysis of these models using some
basic statistic has been carried out and is shown in Table
5.1
where the LLR model
outperformed both ANN models and provided the best performance, i.e. the lowest
RMSE and highest R
2
, for the training period and validation periods. The results of
the study also indicate that the predictive capability of BFGS algorithm are poor
compared with those of Conjugate Gradient networks in daily solar radiation
modelling. In the same time the modelling capabilities of Levenberg
Marquardt
ANN is higher than that of conjugate gradient and BFGS algorithm based ANN
models. The performance line diagrams of Levenberg
-
Marquardt ANN model is
data based modelling of daily solar radiation is shown in the Figs.
5.28
and
5.29
.
-