Environmental Engineering Reference
In-Depth Information
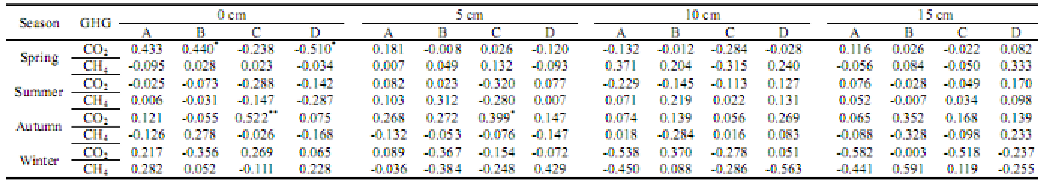
Table 3. Relationships between the flux of CO
2
and CH
4
and soil moisture
Table 4. Correlation analysis between the flux of CO
2
and CH
4
and soil electric conductivity at different soil depths
0 cm
5 cm
10 cm
15 cm
Season
GHG
B
C
D
B
C
D
B
C
D
B
C
D
0.589
**
0.531
*
CO
2
-0.205
0.165
-0.254
-0.151
-0.182
-0.177
0.203
-0.229
-0.112
0.204
Spring
CH
4
-0.264
-0.062
-0.383
-0.030
0.062
0.158
0.002
-0.109
0.361
-0.011
0.059
0.306
CO
2
0.085
-0.011
0.376*
-0.026
-0.416
*
0.321
0.157
-0.427
**
-0.246
0.090
-0.178
-0.318
Summer
CH
4
0.001
0.280
-0.307
0.108
-0.024
-0.290
-0.288
-0.095
0.207
-0.191
-0.146
0.323
-0.463
*
0.536
**
CO
2
0.024
-0.640
0.228
-0.403
0.055
0.055
-0.281
0.276
-0.076
-0.178
Autumn
0.481
*
CH
4
-0.012
0.660
-0.076
0.002
0.053
-0.383
0.176
0.073
-0.282
0.123
-0.013
CO
2
-0.049
0.959
**
0.128
0.227
0.068
0.167
-0.110
-0.243
0.194
-0.333
-0.164
0.207
Winter
CH
4
-0.363
-0.844
-0.441
-0.429
0.129
-0.215
-0.107
-0.253
-0.371
-0.271
-0.335
-0.465