Environmental Engineering Reference
In-Depth Information
Figure 1. Changes of plant height (A), root length (B), fresh weight (C), petiole number (D) stem
diameter(E) and leaf area(F) in different NaCl treatments.
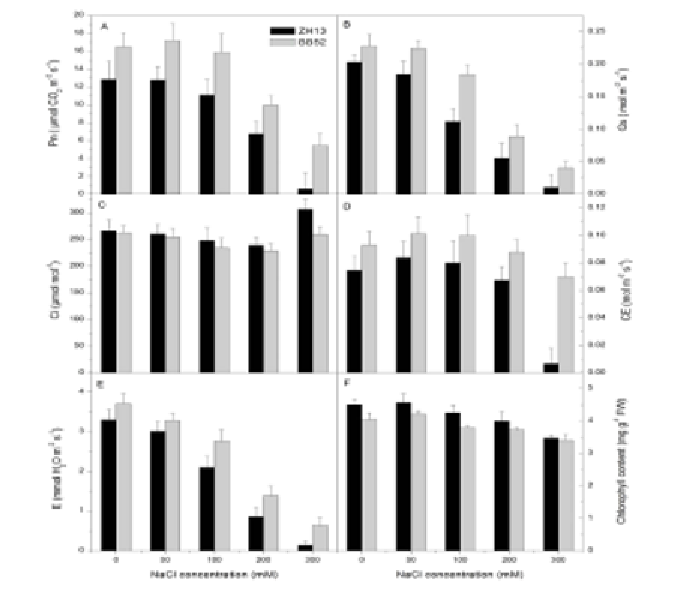
Figure 2. Changes of photosynthetic rate (Pn, A), stomatal conductance (Gs, B), intercellular CO2
concentration (Ci, C), carboxylation efficiency (CE, D), transpiration rate (E, E) and chlorophyll
content (F) in different NaCl treatments.