Biology Reference
In-Depth Information
ware/etdips/
)
. There are many, many software packages that can be
purchased for use in analysis of medical images.
We focus exclusively on landmark data collection from CT images
in this chapter, since these are the data that we find most useful and
accessible. The principles discussed apply to data collected from other
types of medical images (MRI, ultrasound, Positron emission tomogra-
phy) with accommodations made for resolution of the scans produced
by alternate modalities.
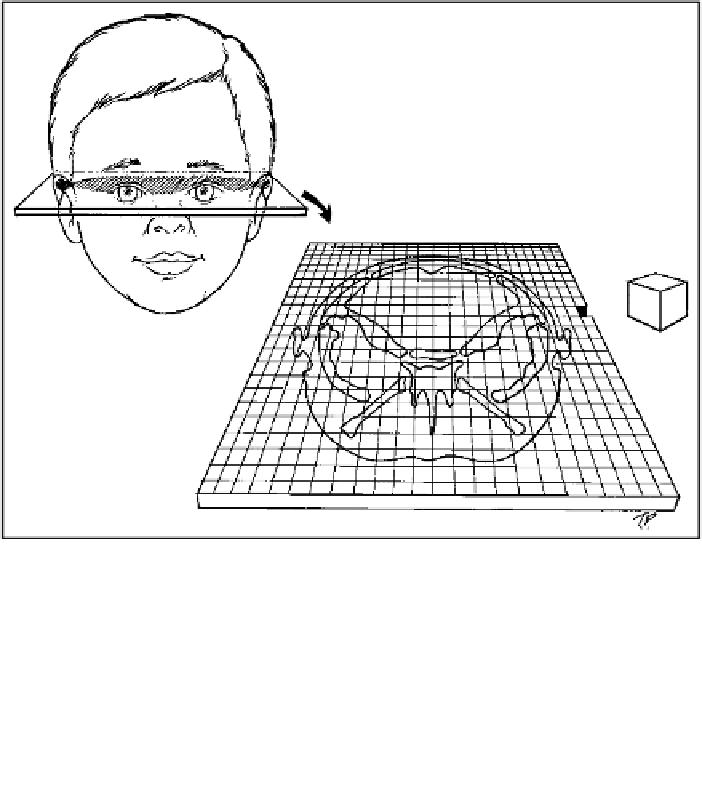
Figure 2.6
Pictorial representation of a single CT slice through the head of a child.
The grid pictured is meant to represent the matrix of pixels (usually 256x256 or
512x512) that produces a picture of the anatomical features based on the linear atten-
uation coefficients that follow a scale having air at one extreme and a dense
substances (e.g., mercury) at the other extreme. All tissues are assigned a score based
on this scale. Pixels size, the dimension of a unit in the X and Y plane is used to pro-
duce a scale for the image. When the slices are combined to make a 3D reconstruction,
the scale for the third dimensions, Z, is determined in part by the thickness of the slice
images. A unit in the 3D matrix reconstructed in this way is called a voxel. An example
of a voxel with X and Y units equal to pixel size and Z units equal to slice thickeness is
shown diagrammatically.


Search WWH ::

Custom Search