Biology Reference
In-Depth Information
indicating a pronounced difference in overall three-dimensional struc-
that the most similar triangle spans the A and B chains. When the tol-
increases to include 17 amino acids (12 on the A chain and five on the
B chain), shown in
Figure 7.7
.
In addition, two new, overlapping three-
landmark cliques are found at the end of the B chain: (B28, B29, and
B30) and (B26, B29, and B30). This indicates that, in spite of the pro-
nounced kink in the mutant's B chain, the structure at the end of the
chain (just past B24) is largely preserved. Finally, when the tolerance
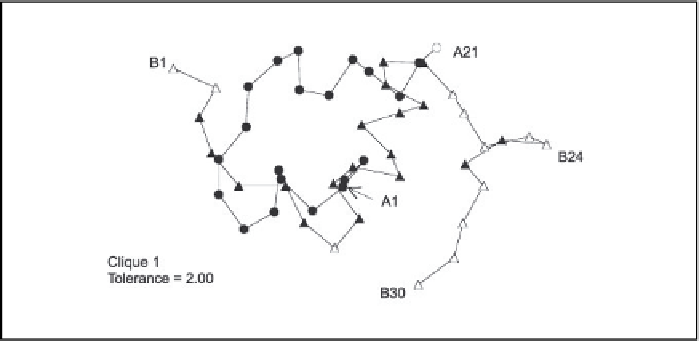
is made substantially larger (
T
=2.00), we see that the clique is expand-
ed to include all but one of the A-chain atoms (A30), as well as many of
the B-chain atoms that are in close proximity to the A chain (
Figure
localized the most important form differences to the sections of the B
chain that flank the mutation site.
We should note an important distinction between this algorithm
and many of the common-substructure algorithms used by molecular
biologists. Many of the available algorithms for molecular shape com-
parison do not have the requirement of specifying atom-to-atom
correspondences. In many applications, the “fit” of two atoms is not a
description of similarity, but is meant literally, as with the binding
between a ligand and its receptor, where the molecules are so dissimi-
Figure 7.8
The first clique found at a high tolerance level (T=2.00), illustrated with
the mutant insulin molecule. The second and third cliques are as in
Figure 7.7
and are
not shown.
Search WWH ::

Custom Search