Biology Reference
In-Depth Information
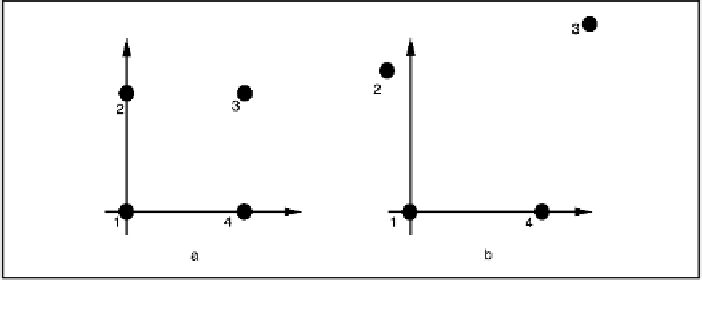
Figure 4.8.
Graphical Representation of landmark location for objects
A
and
B
.
similar to each other than we found originally. We interpret this as a
demonstration of the importance of landmark 3 in establishing the
form difference between these two objects. Similarly if we calculate
T
after deleting landmark 4 (but include landmarks 1, 2, and 3), the
value of
T
, is 1.44. This value of
T
is reduced as compared to the origi-
nal
T
calculated using all landmarks, but the change in the value of
T
is not as large as when landmark 3 was deleted. From this experiment,
we conclude that landmark 3 plays a larger part in determining the
form difference than does landmark 4. Both landmarks are influential
but landmark 3 is more influential than landmark 4.
If we begin this exercise again, but delete landmark 1, the value of
T
is 1.40. This value is similar to the one obtained after deleting land-
mark 4. This implies that landmarks 1 and 4 have comparable
influence. The value of
T
obtained when deleting landmark 2 is 1.5,
indicating that landmark 2 does not explain much of the difference
between the two forms. From these analyses, we can rank the land-
marks according to their influence in the differentiation of forms;
landmark 3 being the most influential, landmarks 1 and 4 having sim-
ilar influence and landmark 2 the least influential of all.
Based on this simple example, we can propose the following proce-
dure for detecting influential landmarks.
STEP 1: Calculate the value of
T
for the complete object.
STEP 2: Delete the
i
-th landmark and recalculate the value of
T
.
Let us denote it by
T
(-1)
. Calculate
T
(-1)
,
T
(-2)
,…,
T
(
-K
)
.
One can consider a landmark to be the most influential if it sub-
stantially reduces the value of the original
T
upon deletion. The
Search WWH ::

Custom Search