Biology Reference
In-Depth Information
mimics the standard in RCM comparisons where the position of land-
mark 7 (tuberculum sella) is matched exactly on the two forms
(samples of forms) and the forms are oriented along a line stretching
from landmark 7 to landmark 1 (nasion). The cranial base is common-
ly used for superimposition as described above because it is thought to
be biologically stable, but this assumption of stability affects the
results of any comparison. Under this superimposition scheme (
Figure
but that the posterior neurocranium (represented by landmarks 10
and 11) in the Apert skull is shallower than the normal skull. The face
9
7
11
8
1
5
2
10
6
3
4
a
b
c
d
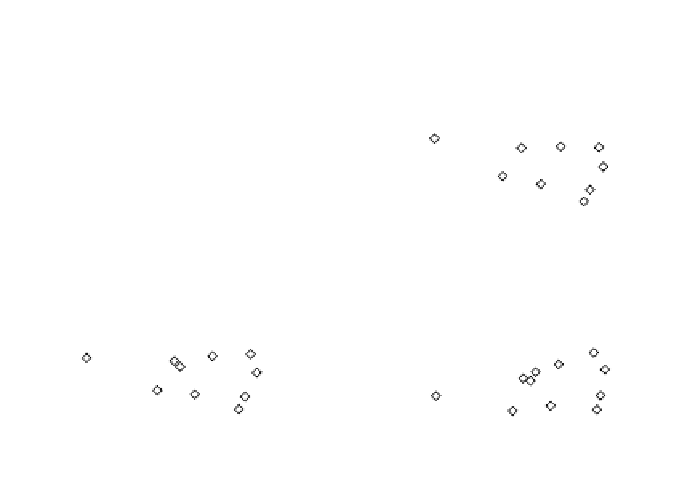
Figure 4.4
This figure demonstrates the lack of invariance of superimposition approach-
es. The upper left quadrant of this figure provides the placement of the landmarks used in
the analysis as closed diamonds on a tracing of a radiograph of an unaffected child's skull.
In the other three quadrants, the position of corresponding landmarks located on the esti-
mated mean forms of the Apert syndrome sample are shown as open diamonds, while the
locations of the corresponding landmarks on the mean form of the unaffected sample are
shown as closed diamonds. The upper right quadrant (b) shows the results of comparing
data collected from the Apert and unaffected samples using the sella-nasion superimposi-
tion. The lower left quadrant (c) shows the results of comparing the same data using the
sella-basion superimposition. The lower right quadrant (d) shows the results of comparing
the same data using the least squares superimposition. Notice that the local differences
between the two forms vary according to which superimposition scheme is used.


Search WWH ::

Custom Search