Geoscience Reference
In-Depth Information
graphic map. It represents
all topographic maps
with similar qualities cre-
ated anywhere and anytime. The dot on the plane of METAMAPS repre-
sents all information on the extension of each and every map sheet belong-
ing to this category of maps.
maps covering Sweden and created with the same qualities during a shorter
production period. It used to be depicted as a rectangular grid net covering
the surface of Sweden. These maps are regularly replaced with an updated
series with a few years interval. Even the previous generation maps can be
represented a similar rectangular grid net. So these reference grid nets
make up a series of layers, representing the history of this particular topo-
graphic map. In practical terms they form a - rather impressive - register.
This register is represented by the red symbol “b” in
Figure 4
.
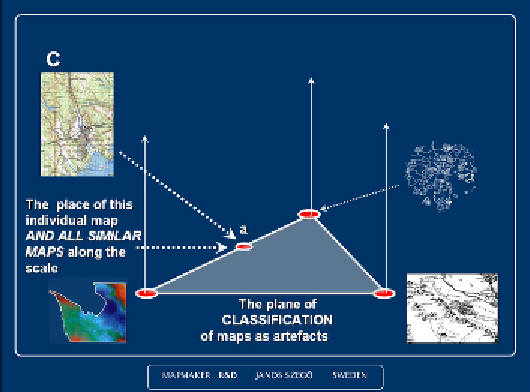
Figure 3:
A part of a topographic map represent a combination of visually observed and
mathematically calculated elements. Its position on the scale coincides with several other
similarly composed maps.
Other, similar maps cover more or less the entire globe. They were created
during a long period of time. Data considering all those maps, their geo-
graphical extension and time aspects is theoretically represented by the
same location on the plane of METAMAPS.
There are far more maps and cartographical creation which could be
located in point “a” in the plane of maps as artefacts. This point represents