Geoscience Reference
In-Depth Information
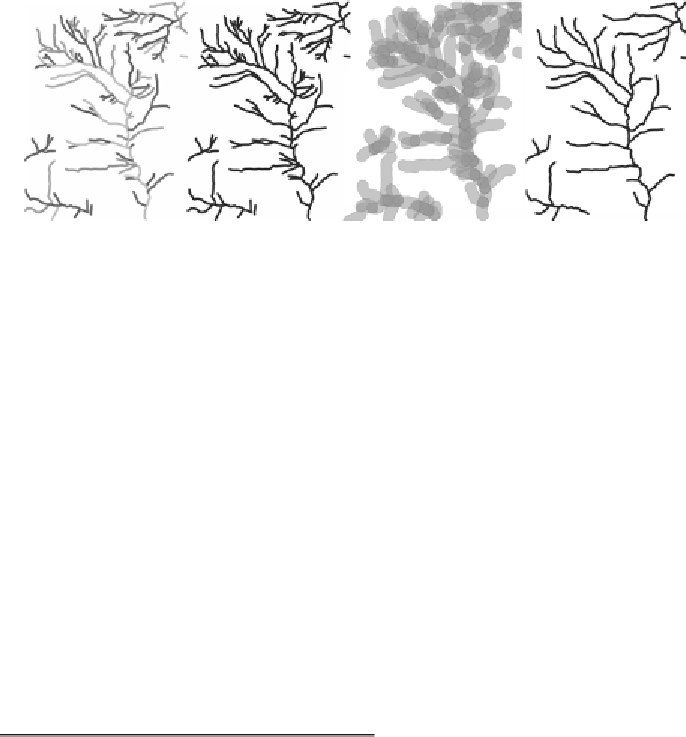
Figure 7:
the four steps in the pruning process; from left to right: river course reconstruc-
tion (different color means different course), pruning on length, calculation of buffers and
overlapping regions, pruning on density.
After some tests, we found that good values for the parameters are:
Pmax
= 50%, buffer size = 120m. A threshold on the values
S
,
L
and
B
of each
river that is candidate to be deleted is used to decide whether this river is
important or it can be pruned; these thresholds, found empirically for the
1:25000 scale, are:
S
< 3,
L
< 1000 meters,
B
< 4.
Table 1
lists all the
parameters used in the generalization process.
Parameter Value
d sampling for width measurement 15 m
Minimum dangling branch length 250 m
Threshold contiguous area-line-area sections 500 m
Buffer size for density pruning
120 m
Pmax percentage of buffer overlap
50%
S max Strahler order
3
L length to furthest source
1000 m
B number of branches uphill
4
Table 1: Parameters used in the generalization process.
3- Results
The overall process has been tested on a sample dataset representing a
mountainous area of the Italian Alps, enclosing around 1300 sq km and
10000 river sections. The results have been visually inspected by expert
cartographers and found generally good.
Table 2
lists the times elapsed by
each step of the generalization process.