Geoscience Reference
In-Depth Information
Fig. 9
clearly shows that the curve for
R_2
monotonically increases in the
same order like for
R_1
. This stands for that the relative local densities of
the points on the initial and on the reduced map have approximately the
same “positions”.
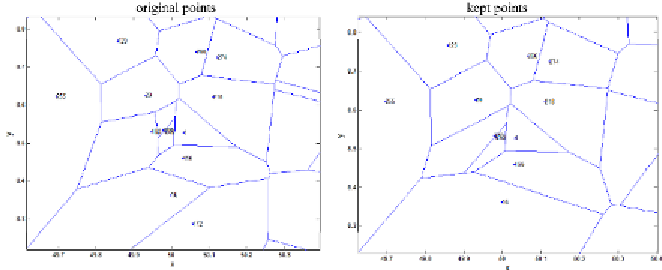
Figure 8:
Voronoi diagram of original points (left) and of the kept points (right)
PRiQt QuPber
r
i
B1 2rigiQaO pRiQt
r
i
B2 SeOected pRiQt
differeQce
16
00022
00183
00161
29
00077
00053
00024
252
00735
00073
00662
255
00009
00182
00173
266
00098
00034
00064
273
00013
00009
00004
378
00621
00160
00461
Table 7:
Relative local density of points before and after generalization for 2D-points
Figure 9:
Curve of relative local density change of kept points (2D) before (green)
and after (blue) generalization