Geoscience Reference
In-Depth Information
defined output scale - the calculated) number of points to be kept (
N
T
).
With each iteration the next smaller value of
d_sort_angle
will be used
and with each step the resulting number of kept points will decrease
whereas the resulting number of eliminated points increases.
Formula (5):
repeat
Δα
= d_sort_angle (n-i+1) for i = 1..m whereby m = number of en-
tries of d_sort_angle
until
>
n-local maxima-local minima-threshold points
]
<= 1
T
whereby n = number of points
•
In case of 3D-point-coordinates we perform these iterative steps of
equation (7) until equation (9) for each 2D-perspective (xy, xz, yz) and
we have to determine the identical kept points which are common for
the three perspectives (
N
Txy,
N
Txz,
N
Tyz
). In that case the iteration stops
when the number of these identical kept points of all three perspectives
reaches the number of the user-defined points to be kept.
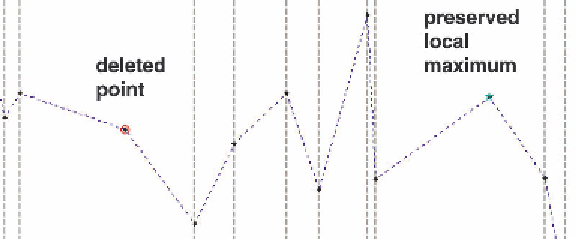
The determined kept (kept) points and the points to be eliminated can now
be plotted as demonstrated in
Fig. 3
.
The benefits of our new enhanced Polarization approach are summarized
in the following list:
•
it allows a scale-dependent selection/generalization of point data
•
not only for x,y- point data but also for static and dynamic point data in
2D or 3D (x,y,z,t)
•
with an calculation simplicity it is applicable as an Web-application
•
through an interactive tool the user can upload any point data set and
define either the output scale or the achieved number of points which he
wants to be eliminated
•
point selection while keeping still the global and local characteristic of
the point data distribution and point data densities
Figure 3