Geoscience Reference
In-Depth Information
2 ApprRach & PethRds
Within the Polarization Transformation, described in Qian et al. (2006),
first of all a Polarization center (
P
c
) will be determined computationally.
That point
P
c
has the maximum average length to all other points.
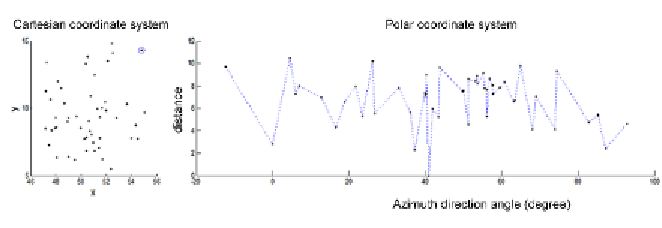
Now the distances of each point to Pc and their relative orientations can be
calculated and displayed in the polar coordinate system (i ; rc,i) shown in
(
Figure 1
):
Figure 1:
A sample point data set in the Cartesian and in the transformed Polar coordinate
system
The resulting polar coordinate system then will be unfolded as a spectrum
line. After the transformation, each point from the original cluster has be-
come a node on the spectrum line delimited between 0º and 360º along the
horizontal axis, and between the minimum and maximum polar radius
along the vertical axis. Now the spectrum line can be segmented into
segments. Therefore Qian et al. (2006) predefined thresholds of the polar
angles
empirically, depending on the number of points and on the
azi-
muth direction angles to the neighbor points in the polar coordinate
system
.
Figure2:
Example of a segmented spectrum line