Geoscience Reference
In-Depth Information
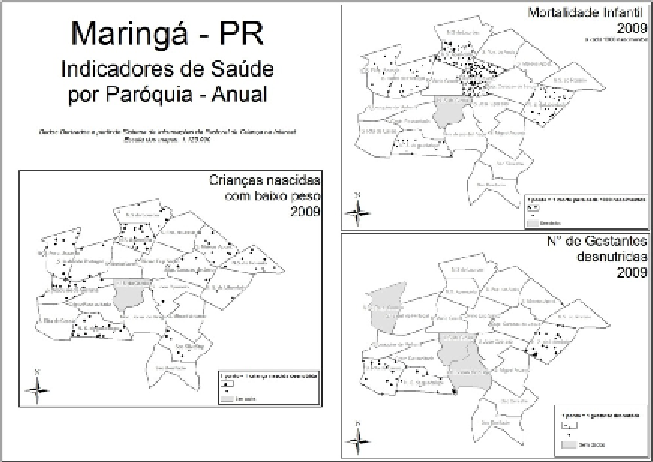
Figure 3:
Out-of-scale subset of dot maps for 2009 indicators
The subsets included maps for different years, with the expectation that the
analytical decision would take into account the evolution of health
indicators over the years. Performance for the test can be divided into three
aspects: the first is about preference, here treated together with what is
considered more efficient. Subjects are instructed to choose the map they
prefer from the three available, which were designed to be similar to ones
presented in popular magazines or newspapers, with real data and a well-
known base map. This step was designed to stimulate users to point out the
preferred cartographic representation at first sight, which involves a pre-
attentive visual perception task. Users were asked not to handle the maps -
which were inside the last page of the test sheet - before answering this
first question.
The second aspect concerns map reading, also called direct acquisition
(MacEachren 1982) tasks. This assessment was designed to test the
comprehension of broader map contents with 14 simple comparison
questions (“a1”, “b2”, “c3” until “o14”), where subjects needed to com-
pare the health indicator differences between parishes and over different
years, deciding whether the sentence was true or false. This step was
intended to evaluate basic map interaction skills and it was designed to
ensure that subjects could distinguish between map units and the associated
classes throughout years.