Environmental Engineering Reference
In-Depth Information
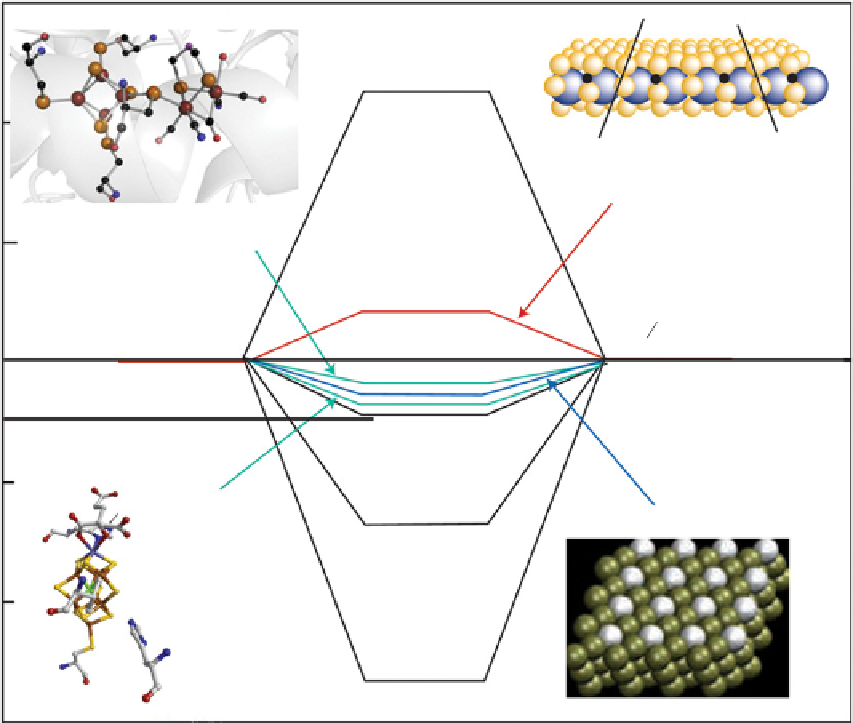
Hydrogen evolution U=0V
0.6
H
*
0.4
Au
MoS
2
Hydrogenase
model
0.2
H
+
+e
-
H
2
1
2
0.0
Pt
-0.2
Nitrogenase
model
Homocitrate
α-442
His
PtBi
Ni
Mo
6
7
5
S
-0.4
α-70
Va l
3
2
1
Fe
C
Mo
N
α-195
His
O
-0.6
Reaction coordinate
figure 25.6
Calculated free energy for hydrogen evolution at a potential U = 0 relative to the standard hydrogen electrode at pH = 0. In this
diagram, au is shown as a compound that does not bind to atomic hydrogen and Mo is shown as a compound that forms strong bonds with
atomic hydrogen. For both cases, hydrogen evolution is slow. reprinted with permission from ref. [62]. © 2005, american Chemical Society.
small nanoparticles could form in this condition. Without the protein, larger particles are formed. BSa can also help to disperse
these nanoparticles in a solution and the dispersity of particles (or minerals) in water could increase the rate of reaction of
particles with other substrates. Other groups reported similar results. One of the numerous and very small nanoparticles
produced in the presence of protein could be formed in an appropriate location in proteins and be used as a primitive inorganic
core (cofactor) of an enzyme. In other words, the author proposes that the cofactor formation in particular enzymes could be
biomineralization in the presence of a protein.
25.1
methoDs
25.1.1
material
all reagents and solvents were purchased from commercial sources and were used without further purification. Mid-infrared
(MIr) spectra of KBr pellets of compounds were recorded on a Bruker vector 22 in the range between 400 and 4000 cm
−1
.
Transmission electron microscopy (TeM) and scanning electron microscopy (SeM) were carried out with Philips CM120 and
leO 1430VP, respectively. The X-ray powder patterns were recorded with a Bruker, D8 aDVaNCe (germany) diffractometer
(Cu-Kα radiation). Manganese atomic absorption spectroscopy (aaS) was performed on an atomic absorbtion Spectrometer
Varian Spectr aa 110.